Discover the origins and history of NASCAR

The Origins and History of NASCAR: From Moonshine Runs to Road-Saving Innovations | Traffic Safety Guide The Origins and...

Are Electric Bikes Causing Traffic Safety Issues?

Are Electric Bikes Causing Traffic Safety Issues? Electric bikes (e-bikes) have surged in popularity, offering an eco-friendly alternative to...

5 Worst Traffic Jams in US History

The 5 Worst Traffic Jams in U.S. History: Causes, Impacts & Lessons Learned From blizzards and music festivals to...

5 Safe Driving Tips for New Drivers

5 Safe Driving Tips for New Drivers 5 Safe Driving Tips for New Drivers Driving for the first time...

How do you jumpstart a car or truck, a complete guide

How to Safely Jump-Start a Car With a Dead Battery How to Safely Jump-Start a Car With a Dead...
Uncategorized
Discover the origins and history of NASCAR
Traffic Safety
Are Electric Bikes Causing Traffic Safety Issues?
Traffic Facts, Traffic Safety
5 Worst Traffic Jams in US History
Traffic Safety
5 Safe Driving Tips for New Drivers
Highway Safety, Traffic Facts, Traffic Safety
How do you jumpstart a car or truck, a complete guide
rear end car crash
Traffic Facts

Is the Rear Driver Always at Fault in a Rear-End Collision?

Is the Rear Driver Always at Fault in a Rear-End Collision?

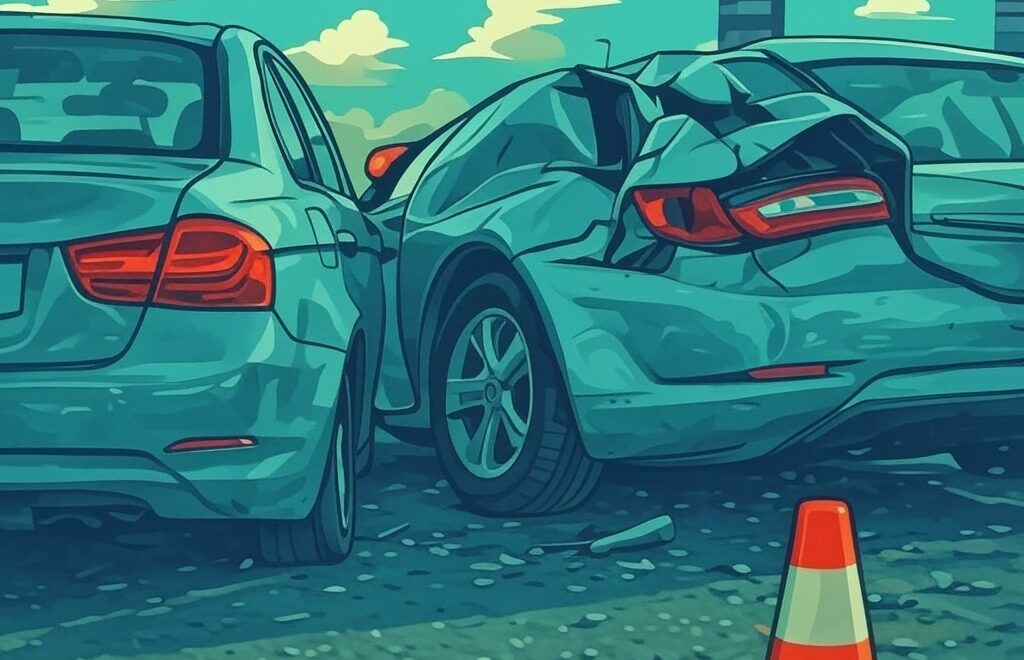
Rear-end collisions are among the most frequent car accidents, making up nearly 29% of all crashes according to the AAA Foundation for Traffic Safety. A common assumption is that the rear driver is always at fault—a belief rooted in traffic laws across all 50 states that require maintaining a safe following distance. But this isn’t an ironclad rule. While the rear driver often bears the blame, fault hinges on specific circumstances, state laws, and exceptions like brake checking or multi-car pileups. This article, brought to you by Traffic Safety Guide, explores how fault is determined in rear-end collisions, why the rear driver is typically (but not always) at fault, notable exceptions, and how state laws on insurance and negligence affect outcomes. A comprehensive table compares these laws across all 50 states to help you understand what to expect in your area.

Why the Rear Driver Is Often Presumed at Fault

The Duty to Maintain a Safe Distance

In most rear-end collisions, the trailing driver is presumed at fault because every state imposes a duty to leave enough space to stop safely. Traffic laws universally require drivers to follow at a distance that’s “reasonable and prudent” given the speed, traffic, and road conditions—often referred to as the “assured clear distance” or safe-following-distance rule. For example, if the car in front brakes suddenly, the rear driver should have enough room to stop without colliding. Failing to do so typically signals negligence on the rear driver’s part.

The Rear-End Doctrine

This duty underpins a legal concept called the rear-end doctrine, which presumes the rear driver was negligent. Police and insurance adjusters often start with this assumption unless evidence suggests otherwise. In New York, for instance, courts have ruled that a rear-end collision with a stopped vehicle establishes a presumption of negligence against the rear driver. The rear driver must then provide a non-negligent explanation—such as the front driver creating an unavoidable hazard—to shift or share blame.

Exceptions: When the Rear Driver Might Not Be Fully at Fault

While the rear driver is often held accountable, several exceptions can shift fault partially or entirely to the front driver or another party. Here are the key scenarios:

Brake Checking or Sudden Unnecessary Stops

If the lead driver slams on their brakes without a valid reason—often as an aggressive reaction to a tailgater (known as brake checking)—they may be deemed negligent. Brake checking is reckless and dangerous, potentially making the front driver fully or partially at fault. For example, if a lead driver brake-checks on a highway, causing a rear-end crash, the rear driver might not be held fully liable if evidence (like dashcam footage) shows the front driver’s actions were intentional.

Unsafe Lane Changes (Cutting In Front)

When a car merges or cuts in front of you and immediately slows or stops, leaving no time to react, the front driver’s improper lane change can make them at fault. Drivers have a duty to change lanes safely without endangering others. For instance, if a driver darts into your lane during heavy traffic and brakes abruptly, insurers may assign blame to them for creating the hazard, reducing the rear driver’s liability.

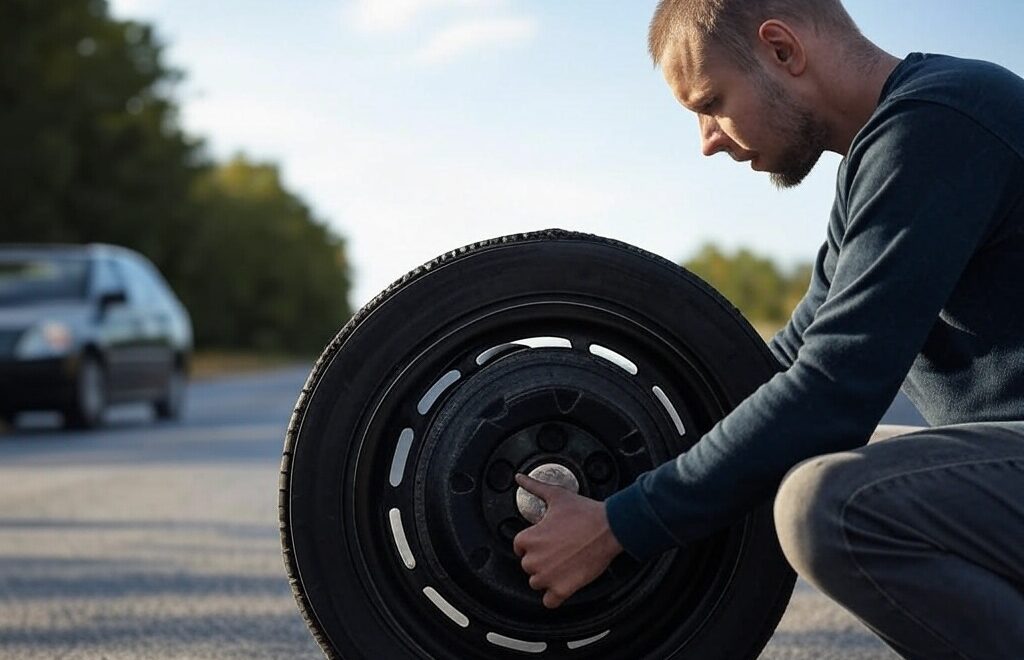
Vehicle Malfunctions (Brake Lights Out or Mechanical Failures)

Sometimes, the rear driver can’t avoid a crash due to the lead vehicle’s failure to provide proper warning. If the front car’s brake lights aren’t working, the rear driver might not realize the car is stopping. Similarly, a sudden mechanical failure—like a tire blowout or brake failure—can shift fault. In these cases, the rear driver’s liability may be reduced if they couldn’t reasonably avoid the collision due to the front driver’s vehicle issues.

Multi-Car Pileups (Chain-Reaction Crashes)

In multi-vehicle rear-end crashes, such as freeway pileups, the initial cause often lies with a driver further back. If you were pushed into the car in front of you by another vehicle behind you, you might not be at fault. Blame typically falls on the driver who started the chain reaction—often the rearmost vehicle that failed to stop. These cases can be complex, with fault apportioned among multiple drivers based on each collision in the chain.

The Role of Evidence

Evidence is crucial in proving these exceptions. Dashcam footage, witness statements, vehicle telematics, or crash reconstruction can demonstrate that “I was pushed into the car in front by another vehicle” or “The lead driver slammed their brakes on purpose.” Such evidence can help the rear driver avoid full liability or share fault with others.

Fault vs. No-Fault Insurance Systems: How Claims Are Handled

Understanding Fault and Insurance

Determining fault in a rear-end collision is distinct from how insurance claims are processed. Most states are “fault” states (also called tort liability states), where the at-fault driver’s liability insurance covers the other party’s damages. However, 12 states use a no-fault system, where each driver’s insurance pays for their medical injuries through Personal Injury Protection (PIP) coverage, regardless of fault. States like Florida, Michigan, New York, New Jersey, and Pennsylvania are no-fault, meaning minor injury claims are first handled by each driver’s PIP coverage.

Why Fault Still Matters in No-Fault States

Even in no-fault states, fault isn’t irrelevant. It determines who pays for property damage (like vehicle repairs) and injuries that exceed PIP limits or meet a severity threshold (e.g., permanent injury). No-fault states often restrict lawsuits for bodily injury unless injuries are serious or medical costs surpass a certain amount. In significant crashes, the at-fault driver’s insurance remains liable for damages beyond PIP. So, if you’re the rear driver and at fault, your liability insurance will likely cover damages in both fault and no-fault states—the difference is that in a no-fault state, the other driver’s minor injury claims might be paid by their PIP first.

Comparative vs. Contributory Negligence: How States Share Fault

The Two Main Approaches

When both drivers are negligent to some degree, state laws determine how fault is shared using either comparative or contributory negligence rules:

  • Contributory Negligence (Few States): In states like Alabama, Maryland, North Carolina, Virginia, and the District of Columbia, if you’re even 1% at fault, you can’t recover damages. This harsh rule means that if the front driver contributed to the crash (e.g., by stopping suddenly in an unsafe manner), they might recover nothing, even if the rear driver was mostly at fault. For example, if a front driver in Virginia brake-checks and is found 10% at fault, they could be barred from recovering damages despite the rear driver’s 90% fault.
  • Comparative Negligence (Most States): Most states (45) use comparative negligence, where damages are reduced by your percentage of fault:
    • Pure Comparative Negligence: You can recover damages regardless of your fault percentage, reduced proportionally. For instance, in California, a driver 80% at fault can still recover 20% of their damages. About a dozen states, including California, New York, and Louisiana, follow this rule.
    • Modified Comparative Negligence: You can recover only if your fault is below a threshold (50% or 51%):
      • 51% Bar: Recover if 50% or less at fault (e.g., Texas, Illinois). If both drivers are 50/50 at fault, each can recover 50% of their damages.
      • 50% Bar: Recover if 49% or less at fault; 50% or more bars recovery (e.g., Georgia, Tennessee). If fault is 50/50, neither recovers.

A Unique Case: South Dakota

South Dakota uses a “slight vs. gross” negligence rule, where a plaintiff can recover only if their fault is “slight” compared to the defendant’s “gross” negligence. In rear-end cases, the rear driver’s fault is often considered “gross” (e.g., tailgating), while the front driver’s fault might be “slight” (e.g., a sudden but justified stop), allowing the front driver to recover reduced damages.

Practical Impact on Rear-End Collisions

In comparative negligence states, fault can be shared. For example, if the rear driver is 80% at fault for tailgating but the front driver is 20% at fault for brake-checking, the front driver can recover 80% of their damages in a pure comparative state like California. In a modified comparative state like Texas (51% bar), the front driver can still recover 80%, but the rear driver (over 50% at fault) recovers nothing. In a contributory negligence state like Maryland, that 20% fault would bar the front driver from recovering anything.

State-by-State Comparison of Rear-End Collision Liability Laws

The table below provides a state-by-state breakdown of insurance systems (fault vs. no-fault), negligence rules (comparative vs. contributory), and notable laws or precedents affecting rear-end collision liability. Use this to understand how your state might handle a rear-end accident.

State Insurance System Negligence Rule Notable Law/Precedent on Rear-End Liability
Alabama Fault Contributory Negligence Pure contributory negligence; any fault by the lead driver bars recovery. Rear driver presumed negligent for unsafe following distance.
Alaska Fault Pure Comparative Negligence Pure comparative negligence; rear driver usually at fault unless front driver contributed.
Arizona Fault Pure Comparative Negligence Pure comparative negligence; rear driver presumed negligent unless unusual circumstances apply.
Arkansas Fault Modified Comparative (50% bar) 50% bar; rear driver typically at fault unless lead driver’s actions were equally negligent.
California Fault Pure Comparative Negligence Pure comparative negligence; rear driver presumed negligent but can rebut with evidence of front driver’s fault (e.g., brake checking).
Colorado Fault Modified Comparative (50% bar) 50% bar; rear driver at fault for violating “assured clear distance” unless front driver equally at fault.
Connecticut Fault Modified Comparative (51% bar) 51% bar; rear driver assumed negligent but can recover if 50% or less at fault.
Delaware Fault Modified Comparative (51% bar) 51% bar; rear driver typically at fault for following too closely.
Florida No-Fault Modified Comparative (51% bar) No-fault state with 51% bar; rear driver presumed negligent but fault can be split if lead driver was negligent.
Georgia Fault Modified Comparative (50% bar) 50% bar; rear driver usually at fault for tailgating; front driver must be less than 50% at fault to recover.
Hawaii No-Fault Modified Comparative (51% bar) No-fault with 51% bar; rear driver presumed at fault but can recover if 50% or less at fault.
Idaho Fault Modified Comparative (50% bar) 50% bar; rear driver at fault for not maintaining safe distance unless front driver equally at fault.
Illinois Fault Modified Comparative (51% bar) 51% bar; rear driver presumed negligent for not following at a safe distance.
Indiana Fault Modified Comparative (51% bar) 51% bar; rear driver typically at fault unless front driver’s fault exceeds 50%.
Iowa Fault Modified Comparative (51% bar) 51% bar; rear driver at fault for not keeping clear stopping distance.
Kansas No-Fault Modified Comparative (51% bar) No-fault with 51% bar; rear driver usually at fault; front driver can recover if 50% or less at fault.
Kentucky No-Fault (Choice) Pure Comparative Negligence Choice no-fault with pure comparative negligence; fault can be split in any proportion.
Louisiana Fault Pure Comparative Negligence Pure comparative negligence; rear driver presumed negligent but fault can be apportioned (La. R.S. 32:81).
Maine Fault Modified Comparative (50% bar) 50% bar; rear driver typically at fault; front driver must be less than 50% at fault to recover.
Maryland Fault Contributory Negligence Contributory negligence; any fault by lead driver bars recovery.
Massachusetts No-Fault Modified Comparative (51% bar) No-fault with 51% bar; rear driver usually at fault unless front driver exceeds 50% fault.
Michigan No-Fault Modified Comparative (51% bar) No-fault with 51% bar; rear driver presumed negligent; fault matters for non-economic damages.
Minnesota No-Fault Modified Comparative (51% bar) No-fault with 51% bar; rear driver typically at fault; front driver can recover if 50% or less at fault.
Mississippi Fault Pure Comparative Negligence Pure comparative negligence; fault can be split, rear driver usually at fault.
Missouri Fault Pure Comparative Negligence Pure comparative negligence with rear-end doctrine; rear driver must rebut negligence presumption.
Montana Fault Modified Comparative (51% bar) 51% bar; rear driver presumed at fault; front driver can recover if 50% or less at fault.
Nebraska Fault Modified Comparative (50% bar) 50% bar; rear driver typically at fault; front driver must be less than 50% at fault to recover.
Nevada Fault Modified Comparative (51% bar) 51% bar; rear driver presumed at fault; front driver can recover if 50% or less at fault.
New Hampshire Fault Modified Comparative (51% bar) 51% bar; rear driver usually at fault; front driver can recover if 50% or less at fault.
New Jersey No-Fault (Choice) Modified Comparative (51% bar) Choice no-fault with 51% bar; rear driver presumed at fault; front driver can recover if 50% or less at fault.
New Mexico Fault Pure Comparative Negligence Pure comparative negligence; fault can be split in any ratio.
New York No-Fault Pure Comparative Negligence No-fault with pure comparative negligence; rear driver presumed negligent but can rebut with evidence.
North Carolina Fault Contributory Negligence Contributory negligence; any fault by lead driver bars recovery.
North Dakota No-Fault Modified Comparative (50% bar) No-fault with 50% bar; rear driver typically at fault; front driver can recover if less than 50% at fault.
Ohio Fault Modified Comparative (51% bar) 51% bar; rear driver presumed at fault for violating “assured clear distance” rule.
Oklahoma Fault Modified Comparative (51% bar) 51% bar; rear driver presumed negligent; front driver can recover if 50% or less at fault.
Oregon Fault Modified Comparative (51% bar) 51% bar; rear driver typically at fault; front driver can recover if 50% or less at fault.
Pennsylvania No-Fault (Choice) Modified Comparative (51% bar) Choice no-fault with 51% bar; rear driver presumed at fault; front driver can recover if 50% or less at fault.
Rhode Island Fault Pure Comparative Negligence Pure comparative negligence; fault can be apportioned, rear driver usually at fault.
South Carolina Fault Modified Comparative (51% bar) 51% bar; rear driver presumed at fault; front driver can recover if 50% or less at fault.
South Dakota Fault “Slight-Gross” Comparative Negligence Unique slight vs. gross rule; rear driver typically at fault unless front driver’s fault is more than slight.
Tennessee Fault Modified Comparative (50% bar) 50% bar; rear driver usually at fault; front driver must be less than 50% at fault to recover.
Texas Fault Modified Comparative (51% bar) 51% bar; rear driver presumed at fault for violating “assured clear distance” rule (Texas Transportation Code § 545.062).
Utah No-Fault Modified Comparative (50% bar) No-fault with 50% bar; rear driver typically at fault; front driver can recover if less than 50% at fault.
Vermont Fault Modified Comparative (51% bar) 51% bar; rear driver presumed at fault; front driver can recover if 50% or less at fault.
Virginia Fault Contributory Negligence Contributory negligence; any fault by lead driver bars recovery.
Washington Fault Pure Comparative Negligence Pure comparative negligence; fault can be split, rear driver usually at fault.
West Virginia Fault Modified Comparative (51% bar) 51% bar; rear driver presumed at fault; front driver can recover if 50% or less at fault.
Wisconsin Fault Modified Comparative (51% bar) 51% bar; rear driver presumed at fault; front driver can recover if 50% or less at fault.
Wyoming Fault Modified Comparative (51% bar) 51% bar; rear driver presumed at fault; front driver can recover if 50% or less at fault.

Disclaimer: This article is for informational purposes only and does not constitute legal advice. Laws regarding fault in rear-end collisions vary by state and can change over time. Always consult your local and state laws, as well as your insurance company, to understand how fault and liability may apply in your specific situation.

Sources

The information in this article is drawn from state statutes, case law on negligence and insurance systems, and traffic laws like the Texas Transportation Code § 545.062, which mandates safe following distances. Courts in many states recognize a rebuttable presumption of rear-driver negligence in rear-end crashes. No-fault state details are based on insurance law references, and negligence standards are derived from comparative fault surveys and state-specific legal precedents. For more on safe driving, check out resources from the NHTSA.

The rear driver isn’t always at fault in a rear-end collision, but they often are due to the universal duty to maintain a safe distance. Exceptions like brake checking, unsafe lane changes, vehicle malfunctions, or chain reactions can shift or share blame. State laws on negligence and insurance—whether contributory or comparative, fault or no-fault—further shape outcomes. Documenting the scene with dashcams or witness statements can help prove your case. Above all, safe driving and proper following distances are your best defense against rear-end crashes and the legal battles that may follow. For more traffic safety tips and resources, visit the Traffic Safety Guide to stay informed and prepared on the road.

© 2025 Traffic Safety Guide. All rights reserved.

Continue reading
workzone speeding car
Traffic Safety

Speeding Through Work Zones: A Deadly Gamble

Speeding Through Work Zones: A Deadly Gamble

Work zones are danger zones—speeding through them risks lives. Here’s why slowing down is non-negotiable.

Why Speeding Spells Trouble in Work Zones

Speeding turns a tricky drive into a potential tragedy. Here’s how it fuels chaos in construction zones:

  • Shrinking Reaction Windows: High speeds slash the time to dodge lane closures, workers, or debris—collisions loom large.
  • Deadlier Crashes: Speed amplifies impact, making wrecks far more catastrophic for everyone involved.
  • Navigating Chaos: Narrowed lanes and detours confuse fast drivers, sparking accidents.
  • Workers in the Crosshairs: Crews inches from traffic face lethal risks from speeding vehicles.

The Numbers Don’t Lie: Work Zone Crash Stats

The toll of speeding in work zones is stark, backed by data from the National Highway Traffic Safety Administration (NHTSA):

  • In 2022, 974 lives were lost in U.S. work zone crashes, according to NHTSA reports.
  • Speeding ranked as a top cause of these wrecks, contributing to hundreds of preventable deaths.
  • Drivers and passengers—not just workers—suffered most, proving speeding spares no one.

Why Reduced Speed Limits Save Lives

Lower speed limits aren’t optional—they’re lifelines. Here’s why they work:

  • A Buffer for Safety: Slower speeds give drivers room to react and avoid disaster.
  • Taming the Chaos: Reduced pace smooths traffic amid construction hazards.
  • The Law’s Teeth: Speeding fines double in work zones—some face license suspension.

How Drivers Can Step Up for Safety

You hold the key to safer work zones. Try these tips:

  • Respect the Signs: Obey posted speed limits—always.
  • Eyes on the Road: Skip distractions like texting or fiddling with GPS.
  • Heed the Guides: Follow cones, flaggers, and barriers without fail.
  • Plan Smart: Leave early to dodge construction delays.

It’s On All of Us: A Call to Action

Speeding through a work zone isn’t just reckless—it’s a loaded gun. Slowing down can turn a close call into a safe trip. Safety thrives on teamwork between drivers, workers, and lawmakers.

Let’s honor work zones as shared spaces where every life counts. Drive like it—and get everyone home safe.

All Rights Reserved | Traffic Safety Guide 2025
Continue reading
18 wheel truck
Highway Safety

Truck Weight Limits by State for 2025


Truck Weight Limits by State 2025: Comprehensive U.S. Guide


Truck Weight Limits by State 2025: Comprehensive U.S. Guide

Updated as of April 6, 2025

Introduction to Truck Weight Limits

Trucks are the lifeblood of U.S. commerce, transporting roughly 72% of the nation’s freight by weight, per the American Trucking Associations (ATA). From farm produce to heavy machinery, these vehicles keep the economy rolling across state lines. Yet, truck weight limits in 2025 vary widely across the U.S., shaped by federal guidelines and state-specific rules. These regulations balance economic efficiency, road safety, and infrastructure longevity.

This comprehensive guide dives into truck weight limits by state as of April 6, 2025, covering federal standards, state variations, permit processes, and their impact on the trucking industry. Whether you’re a driver plotting a route or a fleet manager optimizing logistics, understanding these rules is key to staying compliant and efficient on America’s highways.

Federal Truck Weight Regulations Explained

The Federal Highway Administration (FHWA) sets a baseline for truck weight limits on Interstate highways: a maximum gross vehicle weight (GVW) of 80,000 pounds. This includes 20,000 pounds per single axle and 34,000 pounds for a tandem axle group, governed by the Federal Bridge Formula introduced in 1975. This formula calculates allowable weight based on axle spacing to protect bridges and roads from excessive strain—a critical measure given the $275 billion annual cost of infrastructure maintenance.

While Interstates follow this federal cap, states have flexibility on non-Interstate roads. They can impose stricter limits to safeguard aging infrastructure or grant higher weights via permits to support local industries like mining or agriculture. Seasonal factors, such as frost laws in northern states during spring thaws, add further complexity. This federal-state dynamic creates a patchwork of 2025 truck weight regulations that demands careful navigation.

Truck Weight Limits by State in 2025

Below is a detailed state-by-state breakdown of maximum GVW limits without special permits, unless noted, as of April 2025. These limits reflect infrastructure capacity, economic needs, and regional priorities—think Michigan’s industrial hauls or Maine’s timber exemptions. For precise permit details or seasonal rules, check each state’s DOT website linked below.

State Max GVW (lbs) Notes Authority Link
Alabama 80,000 Permits up to 100,000 lbs; seasonal restrictions apply Alabama DOT
Alaska 80,000 Permits up to 145,000 lbs on state roads; supports resource extraction Alaska DOT
Arizona 80,000 Permits up to 129,000 lbs for mining, agriculture Arizona DOT
Arkansas 80,000 Permits up to 90,000 lbs on state roads; timber industry focus Arkansas DOT
California 80,000 Permits up to 95,000 lbs for international containers; strict axle rules Caltrans
Colorado 80,000 Permits up to 97,000 lbs; mountain roads limit enforcement Colorado DOT
Connecticut 80,000 Single axle up to 22,400 lbs; permits for urban routes Connecticut DOT
Delaware 80,000 Permits up to 100,000 lbs; small state, strict bridge limits Delaware DOT
Florida 80,000 Permits for agriculture/construction; hurricane prep exemptions Florida DOT
Georgia 80,000 Permits up to 100,000 lbs; supports port traffic Georgia DOT
Hawaii 88,000 Single axle up to 22,500 lbs; island-specific rules Hawaii DOT
Idaho 80,000 Permits up to 129,000 lbs; logging, farming focus Idaho DOT
Illinois 80,000 Permits up to 88,000 lbs; Chicago metro exemptions Illinois DOT
Indiana 80,000 Single axle up to 22,400 lbs; manufacturing hub Indiana DOT
Iowa 80,000 Permits up to 96,000 lbs for ag goods; seasonal frost laws Iowa DOT
Kansas 80,000 Permits up to 85,500 lbs; grain transport focus Kansas DOT
Kentucky 80,000 Permits up to 96,000 lbs; coal, bourbon industries Kentucky DOT
Louisiana 80,000 Permits up to 88,000 lbs; oil, gas transport Louisiana DOTD
Maine 100,000 6 axles on Interstates; timber industry driver Maine DOT
Maryland 80,000 Permits up to 100,000 lbs; port, urban focus Maryland DOT
Massachusetts 80,000 Permits up to 99,000 lbs; aging bridges limit increases MassDOT
Michigan No cap Up to 170,000 lbs with 17 axles; industrial legacy Michigan DOT
Minnesota 80,000 Permits up to 90,000 lbs; frost laws in spring Minnesota DOT
Mississippi 80,000 Permits up to 95,000 lbs; timber, poultry Mississippi DOT
Missouri 80,000 Permits up to 96,000 lbs; central logistics hub Missouri DOT
Montana 80,000 Permits up to 131,000 lbs; mining, ranching Montana DOT
Nebraska 80,000 Permits up to 95,000 lbs; agribusiness focus Nebraska DOT
Nevada 80,000 Permits up to 129,000 lbs; mining support Nevada DOT
New Hampshire 80,000 Permits up to 99,000 lbs; rural road limits New Hampshire DOT
New Jersey 80,000 Permits up to 100,000 lbs; dense urban routes New Jersey DOT
New Mexico 80,000 Permits up to 86,400 lbs; oil, gas focus New Mexico DOT
New York 80,000 Permits up to 117,000 lbs (7 axles); Thruway rules New York DOT
North Carolina 80,000 Permits up to 94,500 lbs; furniture, textiles North Carolina DOT
North Dakota 80,000 Permits up to 105,500 lbs; oil, agriculture North Dakota DOT
Ohio 80,000 Permits up to 120,000 lbs; manufacturing hub Ohio DOT
Oklahoma 80,000 Permits up to 90,000 lbs; energy sector Oklahoma DOT
Oregon 80,000 Permits up to 105,500 lbs; timber, tech Oregon DOT
Pennsylvania 80,000 Permits up to 125,000 lbs; steel, coal Pennsylvania DOT
Rhode Island 80,000 Single axle up to 22,400 lbs; small state limits Rhode Island DOT
South Carolina 80,000 Permits up to 100,000 lbs; port traffic South Carolina DOT
South Dakota 80,000 Permits up to 129,000 lbs; agriculture, ranching South Dakota DOT
Tennessee 80,000 Permits up to 90,000 lbs; logistics hub Tennessee DOT
Texas 80,000 Permits up to 84,000 lbs; oil, cattle focus Texas DOT
Utah 80,000 Permits up to 129,000 lbs; mining, energy Utah DOT
Vermont 80,000 Permits up to 99,000 lbs; rural infrastructure Vermont DOT
Virginia 80,000 Permits up to 100,000 lbs; port, military Virginia DOT
Washington 80,000 Permits up to 105,500 lbs; tech, agriculture Washington DOT
Washington, D.C. 80,000 Federal limits apply; urban constraints D.C. DOT
West Virginia 80,000 Permits up to 90,000 lbs; coal, timber West Virginia DOT
Wisconsin 80,000 Permits up to 90,000 lbs; dairy, paper Wisconsin DOT
Wyoming 80,000 Permits up to 117,000 lbs; energy, ranching Wyoming DOT

Permits and Enforcement of Truck Weight Limits

For loads exceeding standard limits, states issue overweight permits, often requiring additional axles, designated routes, or time restrictions to minimize road damage. Permit costs vary widely—$15 in Kansas for a single trip up to 85,500 pounds, versus $500 or more in Michigan for annual permits exceeding 150,000 pounds. Some states offer industry-specific exemptions, such as California’s allowance for international containers or Iowa’s seasonal agricultural permits.

Enforcement is rigorous, utilizing weigh stations, portable scales, and Weigh-in-Motion (WIM) technology embedded in highways. Penalties for violations range from modest fines ($10 per pound over in Texas) to steep punishments ($65 per pound in Illinois), with repeat offenders risking license points or jail time. Overloading not only incurs financial penalties but also increases wear on brakes and suspension, raising safety risks—a 2021 FHWA study estimated overloaded trucks contribute to 15% of pavement damage nationwide.

Industry Impacts and Ongoing Debates

Truck weight limits shape more than just daily operations—they influence economic and environmental outcomes. The ATA argues that raising the federal limit to 91,000 pounds with an additional axle could reduce truck trips by 14%, cutting fuel consumption and emissions. A 2023 study by the National Academy of Sciences estimated this could save $1.2 billion annually in shipping costs. States like Maine and Michigan, with higher limits, cite fewer accidents per ton-mile as evidence of efficiency gains.

However, opposition is fierce. The Coalition Against Bigger Trucks (CABT) warns that heavier trucks exacerbate bridge deterioration—over 47,000 U.S. bridges were structurally deficient in 2024, per the FHWA. Safety advocates highlight that a truck’s stopping distance increases by 30% when loaded beyond 80,000 pounds, contributing to 5,600 fatal truck crashes in 2021. Rail companies also lobby against increases, fearing a loss of freight to highways. In Congress, bills like the Safe Highways and Infrastructure Preservation Act (SHIPA) aim to freeze limits, while pro-trucking proposals stall amid budget concerns.

For truckers, the stakes are practical: a load legal in Idaho might trigger fines in Oregon, forcing detours or offloading. Fleet operators invest in compliance tools like axle weight calculators and telematics, but the patchwork of rules remains a logistical headache. As infrastructure funding debates heat up in 2025, weight limits will likely stay a flashpoint between progress and preservation.

Conclusion: Navigating Truck Weight Limits in 2025

Navigating truck weight limits requires diligence and adaptability. From federal standards to state-specific quirks, these regulations reflect a complex interplay of safety, economics, and infrastructure realities. Truckers and fleet managers must stay informed—checking DOT websites, securing permits, and planning routes—to keep goods moving legally and safely across America’s highways in 2025. As debates over limits evolve, this guide serves as a critical resource for understanding the rules today and anticipating changes tomorrow.

Disclaimer: This article provides general information on truck weight limits by state as of April 6, 2025, based on available data. Regulations may change, and specific limits or permit requirements can vary by route, vehicle type, or season. Always consult official state Department of Transportation (DOT) resources or legal professionals for up-to-date, authoritative guidance. xAI is not responsible for inaccuracies or decisions made based on this content.


© 2025 Traffic Safety Guide. All rights reserved.


Continue reading
speeding ticket
Traffic Facts

History of Traffic Tickets


The History of Traffic Tickets – Traffic Safety Guide


The History of Traffic Tickets: From Horseback to Highways

Traffic tickets, those dreaded slips of paper handed out by law enforcement, are a familiar part of modern life for drivers worldwide. But their origins are tied to the evolution of transportation itself, reflecting society’s attempts to regulate an increasingly mobile world. From the dusty roads of the 19th century to today’s high-speed highways, the history of traffic tickets is a fascinating journey through innovation, law, and human behavior.

Early Days: Regulating the Roads Before Cars

Before the automobile, traffic laws existed in a rudimentary form. In the 1800s, cities like London and New York were bustling with horse-drawn carriages, pedestrians, and the occasional bicycle. Rules were informal, often enforced by local constables who relied on common sense rather than written codes. For example, in 1868, London introduced the world’s first traffic light—a gas-powered semaphore signal—to manage horse-drawn chaos near Parliament. Violations, though, were rare and usually settled with a stern warning or a small fine paid on the spot.

The concept of a “ticket” as we know it didn’t exist yet. Instead, offenders might be summoned to court or fined directly by an officer. These early regulations focused on preventing collisions and keeping public spaces orderly, but enforcement was inconsistent, and record-keeping was minimal.

The Automobile Revolution and the Birth of Traffic Tickets

The invention of the automobile in the late 19th century changed everything. Karl Benz’s 1886 Motorwagen was just the beginning; by the early 1900s, cars were multiplying on roads designed for slower, simpler traffic. With speed came danger—and the need for control.

The first recorded traffic ticket in the United States is often credited to New York City in 1899. A cab driver named Jacob German was arrested for speeding down Lexington Avenue at a blistering 12 miles per hour in an electric taxi. There was no standardized “ticket” yet; German was hauled off to jail, and the incident made headlines as a curiosity. However, this event signaled a shift: motorized vehicles demanded a new approach to law enforcement.

By 1901, New York state introduced the first driver’s license requirement, and other regions followed suit. Traffic codes began to formalize, with speed limits, right-of-way rules, and restrictions on reckless driving. The “ticket” as a written citation emerged as a practical solution. Officers could issue a fine or court summons without immediate arrest, streamlining enforcement. In 1904, Ohio issued what some consider the first modern traffic ticket to a driver named Harry Myers, caught speeding in Dayton. The fine? A modest $5.

The Rise of the Ticket System

As car ownership exploded in the 1920s—thanks to Henry Ford’s affordable Model T—traffic violations became a daily headache for cities. Police departments established dedicated traffic units, and the ticket system matured. Citations were handwritten, detailing the offense, fine amount, and payment instructions. Speeding was the most common violation, but tickets also covered parking infractions, running stop signs (introduced in 1917), and ignoring the growing number of traffic signals.

The 1930s and 1940s saw further refinements. Radar guns, invented during World War II, were adapted for civilian use by the late 1940s, giving officers a precise tool to catch speeders. Tickets became standardized forms, often in duplicate or triplicate, with carbon copies for record-keeping. Fines varied widely by jurisdiction, but they were increasingly seen as both a deterrent and a revenue source for local governments—a dual role that remains controversial today.

Mid-20th Century: Tickets Go Mainstream

Post-war prosperity in the 1950s and 1960s fueled a boom in car culture, especially in the United States. Highways expanded, suburbs grew, and traffic tickets became a routine part of driving life. The introduction of the interstate highway system in 1956 brought federal standards, but enforcement remained local. Tickets evolved with technology: typewriters replaced handwriting, and by the 1970s, some departments experimented with early computer systems to track violations.

Cultural attitudes toward tickets shifted too. They became fodder for jokes, cartoons, and even songs—like Chuck Berry’s 1960 hit “No Money Down,” which mentions dodging a fine. Yet they also sparked resentment, with drivers grumbling about “speed traps” and overzealous cops.

Modern Era: Digital Tickets and Beyond

The late 20th and early 21st centuries brought traffic enforcement into the digital age. By the 1990s, handheld printers allowed officers to issue tickets on the spot with barcodes and database integration. Red-light cameras and speed cameras, first widely used in Europe, spread to the U.S., automating ticketing and igniting debates over privacy and fairness.

Today, traffic tickets are a blend of old and new. Officers still patrol with radar guns and notepads, but electronic citations can be emailed or paid online. In some places, artificial intelligence analyzes traffic patterns to optimize enforcement. Fines have ballooned—sometimes reaching hundreds of dollars—reflecting both inflation and municipalities’ reliance on ticket revenue.

A Lasting Legacy

From Jacob German’s 12-mph joyride to a modern driver nabbed by a drone-mounted camera, traffic tickets have evolved alongside transportation itself. They’re a testament to society’s ongoing struggle to balance freedom, safety, and order on the roads. Love them or hate them, traffic tickets are here to stay—proof that even in the age of self-driving cars, humans (and their machines) still need a nudge to follow the rules.

Published on Traffic Safety Guide, your go-to resource for staying safe and informed on the roads.


Continue reading
road trip
Traffic Safety

Essential Items for your car on a Road Trip


Road Trip Essentials: Must-Have Items for Your Car


Road Trip Essentials: Must-Have Items for Your Car

Planning a road trip? Whether it’s a cross-country adventure or a weekend getaway, packing the right gear can keep you safe and comfortable. Experts like the American Automobile Association (AAA) and the National Highway Traffic Safety Administration (NHTSA) emphasize preparation for emergencies and comfort. Here’s your ultimate road trip checklist of must-have items, backed by authoritative advice.

1. Car Emergency Kit

The NHTSA recommends a car emergency kit for roadside safety (NHTSA Road Safety). Here’s what to include:

  • First Aid Kit: Bandages, antiseptic wipes, and medications—AAA suggests keeping it stocked for minor injuries (AAA Roadside Safety).
  • Jumper Cables: Essential for a dead battery, a common issue AAA responds to millions of times yearly.
  • Spare Tire & Tools: NHTSA advises checking your spare tire’s condition, plus a jack and lug wrench.
  • Flashlight & Batteries: Vital for visibility, as per AAA’s emergency kit checklist.
  • Basic Toolkit: Screwdrivers and pliers for minor repairs, recommended by automotive experts.

2. Navigation Tools

GPS can fail in remote areas, so backup navigation is key, per AAA’s travel tips:

  • Physical Map or Atlas: A reliable fallback when cell service drops (AAA Travel Info).
  • Car Charger: Keep your phone alive for apps like Google Maps.
  • Portable Power Bank: Extra power for devices, a smart addition for long drives.

3. Food & Water

The Federal Emergency Management Agency (FEMA) advises keeping sustenance in your car for emergencies:

  • Water Bottles: FEMA suggests one gallon per person per day (FEMA Car Preparedness).
  • Non-Perishable Snacks: Granola bars or nuts—easy, long-lasting options.
  • Cooler with Ice Packs: For fresh food or drinks on extended trips.

4. Comfort & Convenience Items

Comfort matters on long drives, and experts agree these road trip essentials help:

  • Blanket or Sleeping Bag: AAA recommends it for unexpected stops or cold nights.
  • Pillow: Neck support for passengers, enhancing rest on the road.
  • Trash Bags: Keep your car clean, a tip from seasoned travelers.
  • Wet Wipes & Hand Sanitizer: Quick hygiene solutions, per CDC travel advice (CDC Travel Tips).

5. Safety & Weather Gear

NHTSA stresses visibility and weather readiness for road safety:

  • Reflective Triangles or Flares: Warn drivers if you’re stopped, a NHTSA must-have (NHTSA).
  • Rain Poncho or Umbrella: Stay dry during pit stops.
  • Sunscreen & Sunglasses: Protect against UV rays, per the American Academy of Dermatology.
  • Winter Essentials: Shovel and ice scraper for cold climates, per AAA.

6. Entertainment & Extras

Keep the journey fun with these additions:

  • Playlist or Audiobooks: Pre-downloaded for offline enjoyment.
  • Notebook & Pen: Track mileage or memories.
  • Cash & Change: For tolls or small vendors, a AAA-recommended backup.

Why These Road Trip Essentials Matter

Preparation is critical, as AAA and NHTSA note—over 40 million Americans needed roadside assistance in 2023 alone. A car emergency kit ensures safety, while comfort items like blankets keep morale high. These essential items for a road trip prepare you for breakdowns, detours, or long stretches without services.

Final Thoughts

Before you roll out, check this road trip checklist against your route—add snow gear for mountains or extra water for deserts. With advice from AAA, NHTSA, and FEMA, you’re set for a safe, enjoyable trip. Where’s your next adventure? Pack smart and hit the road!


Car trunk with road trip essentials like emergency kit, water, and blanket

Continue reading
Traffic Safety

Essential Safety Tips for Motorists Changing a Tire on the Roadside

Essential Safety Tips for Motorists Changing a Tire on the Roadside

A flat tire can strike at the most inconvenient times—whether you’re commuting to work, heading out on a road trip, or simply running errands. While many drivers know how to change a tire, not everyone considers the safety risks involved when doing so on the side of a busy road. Here are some crucial safety tips every motorist should follow to protect themselves and others while changing a tire.

1. Get to a Safe Location First

If your tire goes flat while driving, resist the urge to stop immediately unless absolutely necessary. Instead, slow down gradually and steer your vehicle to a safe, flat location away from traffic. Ideal spots include:

  • A wide shoulder
  • A rest stop
  • A parking lot
  • The far-right side of the road, as far from moving traffic as possible

Avoid hills or soft ground, as these can be dangerous when using a jack.

2. Turn On Your Hazard Lights

Your hazard lights are the first line of defense to alert other drivers that you’re experiencing an issue. Turn them on as soon as you notice the problem and keep them on throughout the tire change to improve visibility.

3. Use Safety Gear and Reflective Items

Visibility is key, especially in low-light conditions or at night. If you have a reflective vest, put it on. Place reflective triangles or road flares behind your vehicle (about 50–100 feet back) to warn oncoming traffic. These simple tools can prevent accidents by giving other drivers time to slow down and steer clear.

4. Engage the Parking Brake and Wheel Wedges

Once safely parked, immediately engage your parking brake. To further secure your vehicle from rolling, place wheel wedges (or heavy objects like bricks or large rocks) in front of or behind the tires opposite the one being changed.

5. Gather Tools and Check for Damage

Make sure you have all the tools you need: a spare tire, lug wrench, jack, and the vehicle’s manual. Check the condition of the spare to ensure it’s properly inflated. Before proceeding, inspect the area around the flat tire to ensure it’s safe to work on and free from sharp objects or debris.

6. Be Cautious When Using the Jack

Only use the jack on solid, level ground and at the designated jacking point of your vehicle (refer to your owner’s manual). Never place any part of your body under the car while it’s lifted. Use the jack solely to raise the vehicle enough to change the tire.

7. Stay Aware of Your Surroundings

While changing the tire, stay focused and alert. Keep an eye on traffic, especially if you’re close to the roadway. Avoid standing on the traffic-facing side of the car whenever possible.

8. Call for Help If Conditions Are Unsafe

If the road is too narrow, traffic is too heavy, or weather conditions make it dangerous to change a tire yourself, don’t risk it. Call roadside assistance or emergency services. Your safety is more important than saving time or money.

9. Check Everything Before Driving Away

Once the new tire is on and the vehicle is back on the ground, ensure all lug nuts are properly tightened and tools are stowed away. Double-check that the flat tire is secured and that no equipment is left on the road.

Final Thought

Changing a tire doesn’t have to be a dangerous task if done with proper precautions. Always prioritize your safety and that of others around you. Preparation is key—keep your roadside emergency kit stocked and know the steps ahead of time. Safe driving starts long before the tire goes flat.

Continue reading
Traffic Facts

Explore the psychology of road rage


The Psychology of Road Rage: Triggers and Solutions for Safer Roads


The Psychology of Road Rage: Unpacking Triggers for Safer Roads

Picture this: You’re driving along, enjoying your favorite tune, when a car cuts you off, forcing a hard brake. Your pulse spikes, fists tighten, and anger surges. For a moment, you’re tempted to tailgate or honk like mad. This is road rage—a driving phenomenon as old as cars themselves, yet increasingly critical in our congested world. What flips a calm driver into a furious one? And how can understanding these psychological triggers make roads safer?

What Sparks Road Rage?

Road rage is an emotional outburst tied to driving, from mild irritation (think excessive honking) to dangerous aggression (like chasing another car). Psychologists pinpoint a mix of triggers.

Stress amplification tops the list. Driving often piles on time pressure or personal woes. A 2019 study found stressed drivers are 30% more likely to act aggressively. The car becomes a pressure cooker—any traffic slight feels personal.

Anonymity fuels it too. In your “vehicular cocoon,” social norms fade. Without face-to-face accountability, inhibitions drop. You’d never yell at someone in a store line—why’s it okay behind the wheel?

Perceived injustice stokes the fire. A cut-off or reckless weave feels unfair, tapping into a primal need for justice. Add traffic congestion—linked to a 15% rise in aggressive driving in cities—and tempers flare.

The Mind Behind Aggressive Driving

Why do some shrug off a near-miss while others rage? Personality plays a role. People prone to anger are twice as likely to lash out on the road. Narcissists, feeling entitled to the asphalt, explode when challenged.

Context matters too. Sleep deprivation dulls impulse control, while cultural norms shape reactions—Japan’s collectivist vibe sees less rage than the U.S.’s individualistic streak.

The Ripple Effect of Road Rage

Road rage isn’t harmless venting. The National Highway Traffic Safety Administration (NHTSA) estimates aggressive driving contributes to 56% of U.S. fatal crashes yearly—over 20,000 deaths. One enraged driver can trigger chaos: tailgating, sudden braking, or swerves. It erodes road trust, turning highways into battlegrounds.

Source: NHTSA, “Aggressive Driving Statistics,” accessed April 3, 2025.

Taming Road Rage: Psychological Solutions

Understanding triggers offers a path to safer roads. Here’s how:

  1. Self-Awareness Campaigns: Teach drivers to check their stress before driving. California’s “Drive Mindful” cut rage incidents by 12% with breathing exercises.
  2. Tech Buffers: Cars could detect tension—think sensors or calming playlists. Toyota’s 2024 concept reroutes to quieter roads.
  3. Calming Road Design: Wider lanes and roundabouts reduce frustration. Dutch roundabouts slashed crashes by 40%.
  4. Empathy Education: Sweden’s programs cut repeat offenses by 25% by teaching drivers to see others’ perspectives.
  5. Cultural Shift: Ditch media glorifying revenge driving for PSAs promoting patience.

The Road Ahead for Traffic Safety

Road rage reflects our stressed, disconnected world. By decoding its psychology—from anonymity to injustice—we can craft smarter fixes. Imagine cars that soothe, roads that calm, and drivers who see humanity, not obstacles. Safer roads start in the mind—time to breathe before we accelerate.

What do you think—could these work where you drive? Got a local road rage twist to share?

© 2025 xAI. All rights reserved.


Continue reading
red light camera
Traffic Facts

The impact of automatic speed and red light cameras on safety


The Impact of Automatic Speed and Red Light Cameras: Safety, Revenue, and State Adoption


The Impact of Automatic Speed and Red Light Cameras: Safety, Revenue, and State Adoption

Published: March 31, 2025

Automatic speed ticket and red light cameras have become a fixture in traffic enforcement across the United States, sparking debates over their effectiveness, financial implications, and ethical considerations. These automated systems, designed to capture violations such as speeding and running red lights, aim to enhance road safety by deterring dangerous driving behaviors. However, their widespread use has also raised questions about whether they truly improve safety or primarily serve as revenue-generating tools for municipalities and states. This article explores the evidence behind their effectiveness, their financial impact, and provides a comprehensive overview of their adoption across the U.S.

Do They Work?

The primary justification for installing automatic speed and red light cameras is to reduce traffic accidents and save lives. Research offers a mixed but generally supportive picture of their effectiveness, particularly when it comes to specific types of crashes.

Red light cameras target one of the most dangerous violations: running red lights, which often leads to severe “T-bone” or right-angle collisions. Studies consistently show that these cameras reduce such incidents. For instance, a Virginia study found a 67% decrease in drivers running red lights at camera-equipped intersections. National data from the Insurance Institute for Highway Safety (IIHS) supports this, noting that red light cameras decrease severe collisions, with a 2021 estimate of 1,109 fatalities linked to red light running—half of whom were pedestrians, cyclists, or occupants of other vehicles. A systematic review published in the British Medical Journal further concluded that speed cameras reduce fatal and serious injury crashes by 11% to 44%, while the UK Department for Transport reported a 22% drop in personal injury collisions and 42% fewer deaths or serious injuries at camera sites.

Speed cameras, meanwhile, address another leading cause of traffic fatalities: speeding, which contributed to 12,151 deaths in the U.S. in 2022, according to the National Highway Traffic Safety Administration (NHTSA). Evidence suggests they are effective at slowing drivers down. A 2024 report from the Fines and Fees Justice Center acknowledged that speed cameras reduce collisions by 20% to 37%, particularly in high-risk areas like school zones and work zones. Signs warning of camera enforcement further amplify this effect, encouraging compliance without necessarily issuing tickets.

However, the picture isn’t universally positive. Red light cameras, while reducing angle crashes, often increase rear-end collisions as drivers brake abruptly to avoid fines. A Houston study from 2003-2014 found that while total crashes dropped slightly after cameras were installed, rear-end accidents rose, offsetting some safety gains. Critics argue that this trade-off muddies their overall impact on driver safety. Additionally, the long-term behavioral change is questionable—fines mailed weeks later lack the immediacy needed to consistently deter violations, unlike physical road design changes such as roundabouts or longer yellow light timings, which have proven more effective in places like Fairfax County, Virginia (96% reduction in violations after extending yellow lights by 1.5 seconds).

In short, automatic cameras work to reduce specific dangerous behaviors and crash types, but their net safety benefit depends on context, implementation, and complementary measures. They are not a panacea, and their effectiveness can be overstated when revenue motives overshadow safety priorities.

Do They Generate Meaningful Revenue?

Revenue generation is a lightning rod in the debate over automatic cameras. Proponents argue that fines fund safety programs, while critics contend they turn drivers into cash cows for governments and private companies.

The financial haul can be substantial. In Illinois, red light cameras collected over $1.56 billion from 2008 to 2023, with Chicago alone accounting for $915.5 million. Chicago’s 169 speed cameras added another $102 million in 2023 from 1.56 million tickets. Maryland’s work zone speed cameras issued 335,888 citations in fiscal year 2023, generating $9.7 million, with fines set to rise from $40 to $250 by 2025. New York City’s red light camera program, expanded in 2024 to cover 10% of intersections, has been a steady revenue stream since 1994, though exact figures vary by year. In California, Rancho Cordova saw red light camera revenue soar from $73,000 to $742,000 between 2012 and 2016 after installing four cameras.

Yet, “meaningful” revenue is relative. For states or large cities, these sums are often a small fraction of total budgets. Florida collected $52 million from red light cameras across 76 jurisdictions in 2013, but this pales against its $100 billion-plus state budget. Texas, before banning red light cameras in 2019, directed excess revenue to trauma centers and transportation, suggesting a public benefit beyond profit. Conversely, smaller municipalities can become heavily reliant on camera income—Bedford Park, Illinois, issued 23 tickets per resident in 2022, raking in $8.3 million since 2008. Critics highlight cases like Crestwood, Illinois, where eight cameras in a town of 10,000 generated $13 million since 2016, pointing to a disproportionate burden on drivers.

Private companies like American Traffic Solutions (now Verra Mobility) and Redflex, often contracted to operate these systems, take a significant cut—sometimes up to 86% of profits, as noted in Arizona. This profit motive has fueled accusations of corruption, such as in Chicago, where a former official was jailed for bribery tied to camera contracts, or Oakbrook Terrace, where the ex-mayor admitted to kickbacks. Lockheed Martin’s contracts once prohibited cities like San Diego from adjusting yellow light times to maintain ticket flows, further stoking skepticism about safety-first claims.

While cameras undeniably generate revenue, their “meaningfulness” varies by jurisdiction. For some, it’s a vital funding source; for others, it’s a drop in the bucket overshadowed by ethical concerns and public backlash.

State Adoption of Automatic Cameras

The use of speed and red light cameras varies widely across the U.S., shaped by state laws, public opinion, and legislative trends. Below is a table detailing which states permit, restrict, or ban these systems as of March 31, 2025, based on available data and recent legislative updates.

State Red Light Cameras Speed Cameras Notes
Alabama Permitted Permitted Used in cities like Birmingham, Montgomery; no statewide ban.
Alaska No specific law No specific law Rarely used; no clear authorization or prohibition.
Arizona Banned Banned Statewide ban on photo enforcement since 2011.
Arkansas No specific law No specific law Rarely used; no clear authorization or prohibition.
California Permitted Permitted Expanded speed camera pilot in 2023 for safety corridors (e.g., LA, SF).
Colorado Permitted Permitted Local option; Denver uses both.
Connecticut Permitted Permitted Added noise cameras in 2024; red light/speed cameras in select areas.
Delaware Permitted Permitted Used in Wilmington and other locales.
Florida Permitted Permitted Red light cameras widespread; speed cameras in school zones.
Georgia Permitted Permitted Local discretion; Atlanta uses both.
Hawaii No specific law No specific law Limited use; no statewide policy.
Idaho No specific law No specific law Rarely used; no clear authorization.
Illinois Permitted Permitted Chicago leads with extensive red light and speed camera networks.
Indiana No specific law No specific law Minimal use; no statewide endorsement.
Iowa Permitted w/ permit Permitted w/ permit 2024 law requires DOT approval; bans mobile cameras in small towns.
Kansas No specific law No specific law Rarely used; no clear policy.
Kentucky No specific law No specific law Limited adoption; no statewide support.
Louisiana Permitted Restricted Reversed speed camera use on Atchafalaya Bridge in 2024.
Maine Banned Banned Statewide prohibition on automated enforcement.
Maryland Permitted Permitted Work zone speed cameras widespread; fines increasing in 2025.
Massachusetts No specific law No specific law Limited use; no statewide authorization.
Michigan Banned Permitted (work zones) 2024 bills allow speed cameras in work zones only.
Minnesota Permitted (limited) Permitted (limited) Allowed in Minneapolis and Mendota Heights work zones as of 2025.
Mississippi Banned Banned Statewide ban on traffic cameras.
Missouri Permitted Permitted Local use (e.g., St. Louis); no statewide ban.
Montana Banned Banned Red light cameras banned since 2009; speed cameras not authorized.
Nebraska No specific law No specific law Rarely used; no clear policy.
Nevada Permitted (handheld) Permitted (handheld) No automated ticketing; cameras must be officer-operated.
New Hampshire Banned Banned Statewide prohibition on automated enforcement.
New Jersey Banned Banned 2024 “Camera Enforcement Inoculation Act” limits out-of-state fines.
New Mexico Permitted Permitted Local option; Albuquerque uses both.
New York Permitted Permitted NYC expanded red light cameras in 2024; speed cameras in school zones.
North Carolina Permitted Permitted Local discretion; Raleigh and others use cameras.
North Dakota No specific law No specific law Minimal use; no statewide policy.
Ohio Permitted Permitted Local use; some restrictions on mobile speed cameras.
Oklahoma Banned Banned 2023 bill prohibits red light cameras; no speed camera use.
Oregon Permitted Permitted Portland expanded photo radar in 2023; relaxed police review rules.
Pennsylvania Permitted Permitted Philadelphia uses red light cameras; speed cameras in work zones.
Rhode Island Permitted Permitted Providence and others use both types.
South Carolina Banned Banned Statewide ban on automated traffic enforcement.
South Dakota Banned Banned Limits sharing driver info for out-of-state camera fines.
Tennessee Permitted Permitted Local option; Nashville uses both.
Texas Banned Permitted (school zones) Red light cameras banned in 2019; speed cameras limited to school zones.
Utah Banned Banned Statewide prohibition on automated enforcement.
Vermont Permitted Permitted Speed cameras allowed on I-89 and I-91 work zones as of 2025.
Virginia Permitted Permitted Local option; reversed ban in 2007 for cities over 10,000.
Washington Permitted Permitted Speed cameras in school/park zones; expanded in 2024.
West Virginia Banned Banned Statewide ban on traffic cameras.
Wisconsin Banned Banned Statewide prohibition on automated enforcement.
Wyoming No specific law No specific law Rarely used; no clear authorization.

Note: “Permitted” indicates state law allows local jurisdictions to use cameras, though adoption varies. “Banned” means a statewide prohibition exists. “No specific law” suggests no clear authorization or ban, often resulting in minimal use. Data reflects trends up to March 31, 2025, based on legislative updates from sources like GHSA, IIHS, and Land Line.

Conclusion

Automatic speed and red light cameras demonstrably reduce certain crashes—red light running and speeding-related incidents—saving lives in targeted scenarios. However, their safety benefits are tempered by increases in rear-end collisions and a reliance on fines that may not sustainably change behavior. Revenue generation is real and significant, especially for smaller municipalities, but it often comes with accusations of profiteering and inequity, disproportionately burdening low-income drivers. State adoption reflects this tension, with a patchwork of policies driven by safety goals, fiscal needs, and public resistance. Ultimately, while cameras can be part of a safety toolkit, engineering solutions like better road design may offer a more equitable and enduring path to safer streets.


Continue reading
self driving car future
Traffic Safety

How Self-Driving Cars Will Transform Traffic Safety


How Self-Driving Cars Impact Traffic Safety: Challenges and Benefits


How Self-Driving Cars Impact Traffic Safety: Challenges and Benefits

Self-driving cars, also known as autonomous vehicles (AVs), represent a revolutionary shift in transportation, promising significant enhancements in traffic safety by drastically reducing human error—the main cause of accidents. Yet, alongside their vast potential, AVs also present immediate challenges that must be carefully addressed.

Short-Term Challenges of Self-Driving Cars

Addressing Safety Incidents and Technical Limitations

Despite their promise, AVs have experienced notable safety incidents. IEEE Spectrum reports at least 25 fatalities linked to autonomous driving technologies in recent years, emphasizing the critical need for rigorous testing and continuous improvement of AV systems (IEEE Spectrum).

Navigating Regulatory and Legal Uncertainties

Regulatory ambiguity remains a significant barrier. Henry Liu, Director of Mcity at the University of Michigan, underscores the urgency of nationwide standardized regulations and testing frameworks. Without consistent regulations, companies struggle to safely and efficiently deploy AV technology across states (Associated Press).

Building Public Trust and Acceptance

Public perception is critical to the success of AVs. Surveys highlighted by the Financial Times reveal growing apprehension due to high-profile incidents. Ensuring transparency and effective communication about AV safety and reliability will be crucial for public acceptance (Financial Times).

Long-Term Benefits of Self-Driving Cars

Significant Reduction in Traffic Accidents

In the long term, AVs have the potential to significantly decrease traffic accidents. The Insurance Institute for Highway Safety (IIHS) demonstrates that automated emergency braking alone can reduce rear-end collisions by nearly 40%, pointing toward the larger potential impact of fully autonomous vehicles on overall safety (IIHS Study).

Enhanced Traffic Efficiency and Reduced Congestion

AV technology can dramatically improve traffic flow and efficiency. Research in Nature Communications indicates that synchronized AV communication at intersections can reduce congestion, optimize travel times, and significantly enhance commuter experiences (Nature Communications).

Effectively Managing Mixed Traffic Environments

However, the coexistence of human-driven and autonomous vehicles presents unique transitional challenges. According to the Brookings Institution, AVs must adeptly manage human unpredictability, requiring sophisticated technologies and thoughtful policy-making to ensure safety during the transition phase (Brookings Institution).

Conclusion: Navigating the Road Ahead

While self-driving cars promise transformative improvements in traffic safety, overcoming initial technical, regulatory, and perceptual hurdles is critical. Continued investment in research, clear communication, and proactive policy-making will ultimately dictate how rapidly and effectively autonomous vehicles become integrated into daily transportation.

© 2025 Traffic Safety Guide. All rights reserved.


Continue reading
Traffic Facts

Bad Traffic In Ancient Rome ?


Traffic in Ancient Rome

Traffic in Ancient Rome

Overview: Ancient Rome, at its height, had a population possibly exceeding one million residents. This large urban center faced challenges in managing the flow of carts, wagons, and pedestrians on narrow streets, prompting early forms of traffic regulation and safety measures. Below is a concise, well-researched overview of how the ancient Romans experienced and managed traffic and traffic safety in the city of Rome.

1. The Nature of Traffic in Ancient Rome

1.1 Rome as a Bustling Metropolis

By the 1st century BCE, Rome had grown into a vast city with a dense population. A city of that size naturally saw a great deal of activity:

  • Commerce and Trade: Goods flowed into Rome from all over the empire, requiring wagons and carts to transport merchandise.
  • Urban Mobility: People traversed the streets on foot or by horse-drawn vehicles, sedan chairs, or even on horseback.
  • Social and Civic Events: Major festivals, processions, and public ceremonies often caused large crowds and restricted normal traffic.

Although ancient Rome lacked modern automobiles, the movement of people and horse-drawn wagons often led to congestion reminiscent of today’s traffic jams.

1.2 Road Infrastructure

Rome’s famed road network extended throughout the empire, but the city streets themselves could be narrow and winding:

  • Paved Streets: Many major roads in Rome were paved with stone slabs, enabling relatively smoother travel compared to dirt surfaces.
  • Sidewalks and Drainage: In higher-status areas, elevated sidewalks and drainage systems helped keep pedestrians separate from carts.

These infrastructural innovations eased travel somewhat, but population growth often outstripped the city’s design, leading to high levels of congestion near markets, the Forum, and other busy districts.

2. Legal Restrictions and Attempts to Manage Traffic

2.1 Julius Caesar’s Traffic Regulations

One of the earliest known legal measures to address overcrowded streets came under Julius Caesar in the 1st century BCE:

  • Time Restrictions: Heavy wagons were prohibited from entering the city center during daylight hours, thereby reducing congestion for much of the day.
  • Exceptions: Certain vehicles, such as those belonging to high-ranking officials or the Vestal Virgins, were granted exemptions.

Caesar’s approach was designed to ease daytime traffic and improve mobility for ordinary citizens.

2.2 Other Imperial Era Edicts

Later emperors refined Caesar’s restrictions:

  • Limiting the Number of Carts: Authorities often restricted pack animals and wagons during peak hours, reducing noise and crowding.
  • Road Maintenance Laws: Aediles (magistrates in charge of public amenities) repaired roads and enforced weight limits on carts.

These measures illustrate official recognition of traffic congestion as a public safety issue.

3. Early Approaches to Traffic Safety

3.1 The Threats of Ancient Traffic

Even with slower vehicles, accidents were common:

  • Collisions: Narrow streets increased the likelihood of carts colliding with each other or with pedestrians.
  • Pedestrian Injuries: Minimal street lighting and a lack of standardized lanes exposed pedestrians to dangers from horses or wagons.
  • Road Hazards: Uneven pavement and obstructed roads led to trips, falls, and vehicle overturns.

3.2 Safety Measures

Although there were no traffic lights or modern speed limits, several practices enhanced safety:

  • Raised Sidewalks: Pedestrians were protected from wheels and hooves, and stepping stones provided a rudimentary crosswalk system.
  • Dedicated Routes and Times: Restricting certain vehicles to night deliveries was an early form of “road rationing,” reducing daytime crowding.
  • Use of Milestones: Along roads outside the city, milestones aided navigation and logistics, indirectly helping to prevent congestion.
  • Oversight by Aediles: Aediles could fine owners of carts in disrepair or vehicles overloaded beyond safe capacity.

4. Social and Cultural Factors Affecting Traffic Management

Several broader factors shaped how Romans managed traffic:

  • Status and Class: Elite Romans often traveled by litter (a carried sedan chair). This method could bypass some congestion but also create bottlenecks if accompanied by large retinues.
  • Public Events: Major festivals, triumphs, and religious observances temporarily banned non-essential traffic in certain areas, alleviating some congestion.
  • Nighttime Noise and Curfews: Many authors, such as Pliny the Younger, complained about carts rumbling through the streets at night, highlighting that shifting traffic to off-hours created new problems.

5. Evaluating Ancient Rome’s Traffic Measures

Rome’s strategies, while rudimentary by modern standards, demonstrate a clear effort to deal with a large city’s challenges:

  • Congestion Recognition: Time-based vehicle restrictions showed that Roman leadership saw traffic as an economic and social issue.
  • Basic Safety Infrastructure: Sidewalks, stepping stones, and penalties for poorly maintained carts offered early standards for public safety.
  • Centralized Regulation: The existence of officials like aediles indicates Rome’s commitment to organized urban management.
  • Balancing Commerce and Comfort: Restricting heavy traffic to off-peak hours helped maintain daytime flow but led to nighttime noise and occasional accidents.

Conclusion

Although ancient Romans did not face motorized vehicles or the vast fleet of cars we see today, the city’s dense population and many wagons, carts, and animals created notable congestion. Time-based restrictions, raised sidewalks, and continuous road maintenance all emerged as ways to manage the challenges of a bustling metropolis. These measures, though simple, represent a surprisingly forward-thinking approach to urban mobility and public safety—a testament to Rome’s enduring legacy of engineering and governance.


Continue reading

Popular posts

The impact of automatic speed and red light cameras on safety

The Impact of Automatic Speed and Red Light Cameras: Safety, Revenue, and State Adoption The Impact of Automatic Speed and Red Light Cameras: Safety, Revenue, and State Adoption Published:...

Truck Weight Limits by State for 2025

Truck Weight Limits by State 2025: Comprehensive U.S. Guide Truck Weight Limits by State 2025: Comprehensive U.S. Guide Updated as of April 6, 2025 Introduction to Truck Weight Limits...