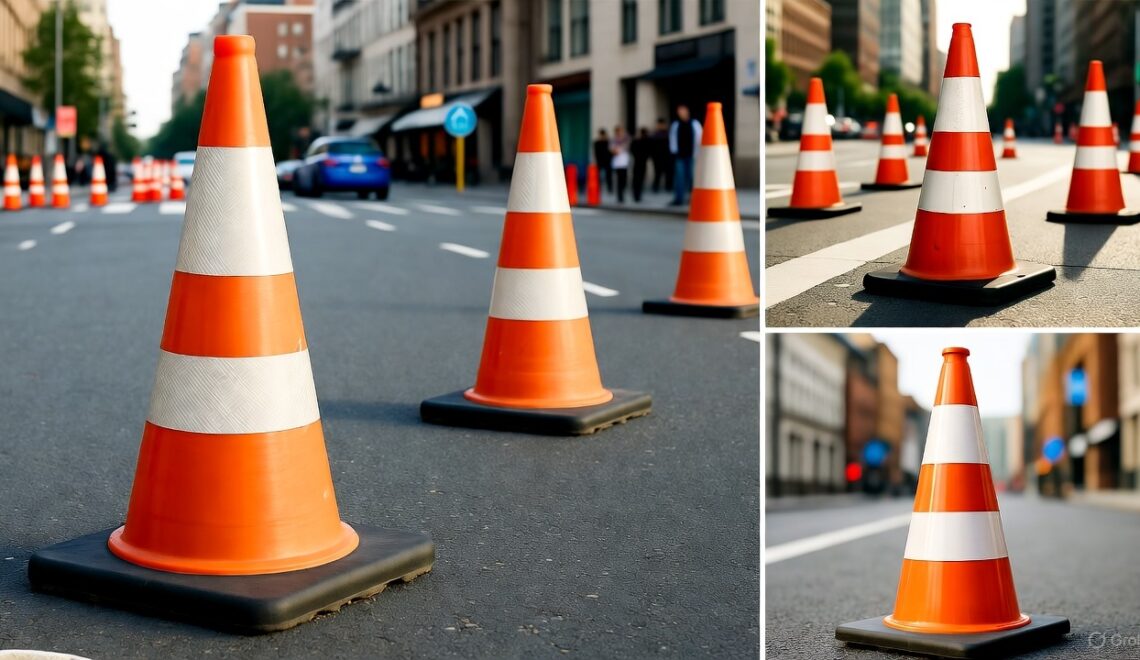
How Many Traffic Cones Are Stolen Each Year? The Hidden Dangers of Tampering with Safety Equipment
Traffic cones—those ubiquitous orange guardians of the road—seem harmless enough, but their frequent theft is no laughing matter. Estimates suggest up to 1 million cones vanish from U.S. streets annually, costing taxpayers millions and endangering lives. Drawing from 2025 reports by the National Safety Council, OSHA, and industry analyses, this article uncovers the scale of the problem and the deadly risks of removing these vital safety tools.
The Theft Epidemic: By the Numbers
Stealing a traffic cone might seem like harmless mischief—think college pranks or viral social media stunts—but the numbers reveal a widespread issue. In the U.S., approximately 1 million traffic cones are stolen every year, representing a significant drain on public resources. This figure has held steady for years, with no signs of slowing in 2025.
Region/Metric
Annual Theft Estimate
Cost Impact
Source
U.S. National
1 million cones
$10–20 million in replacements
Listverse (2023, reaffirmed 2025)
California
8,200 cones
Up to 20% of purchased stock
OPTSIGNS Report (2025)
Door County, WI
20+ cones (single incident)
Local work zone disruption
Door County Sheriff’s Office (2025)
Australia/NZ (referencing U.S.)
Comparable to 1M U.S.
Increased site vulnerabilities
Safe System Solutions (2025)
These thefts aren’t isolated; up to one-fifth of government-bought cones disappear annually, fueling a $2.3 billion “plastic war” in the industry. In California alone, the loss equates to thousands of dollars in replacements, diverting funds from actual safety improvements.
Why Do People Steal Traffic Cones?
The motivations range from the absurd to the opportunistic. Social media challenges dare thrill-seekers to snag cones for likes, while college students treat them as dorm decor staples. In the UK, police have even hosted “cone amnesty” events to recover them. Others steal for resale on black markets or to use as props in events.
Recent X posts highlight the cultural quirk: from “stolen traffic cone” dorm traditions to humorous tales of midnight heists. But what starts as a joke ends in chaos—stolen cones leave work zones exposed, turning safe setups into accident traps.
The Deadly Dangers: Accidents and Fatalities Linked to Tampering
Removing or displacing traffic cones isn’t victimless; it amplifies risks in work zones where workers and drivers collide at high speeds. In 2023, work zone crashes killed 898 people and injured over 40,000, with fatalities up 50% since 2013. About three workers die daily from traffic-related incidents, often in unprotected zones.
Tampering exacerbates this: Cones guide traffic, channel vehicles away from hazards, and alert drivers to dangers. Without them:
Worker Strikes: Flaggers and technicians face heightened risks from distracted drivers. In 2020, an employee was fatally struck while setting up cones near an exit. Another 2017 case saw a traffic technician killed mid-setup.
Driver Crashes: Inadequate barriers lead to pileups; one OSHA report noted cones’ failure to slow traffic contributed to a fatal motorist error.
Backover and Side-Swipe Risks: Construction sites without cones see more backing fatalities and vehicle incursions.
Bystander Harm: Loose cones from trucks have caused multi-car accidents, injuring innocents.
By 2025, projections warn of doubled flagger injuries if theft and tampering persist, straining emergency services and hiking insurance rates.
Real-World Examples: When Cones Go Missing
In Door County, Wisconsin, a 2025 theft of 20 cones left a construction site vulnerable, prompting a sheriff’s plea: “Respect work zones, refrain from tampering.” Similar incidents in Connecticut during storms saw dozens vanish, delaying repairs and exposing crews. Even bodycam footage from arrests shows the escalation: A simple cone grab turned into a high-speed chase, endangering officers.
Solutions and Prevention: Securing Our Roads
Authorities are fighting back. GPS-embedded “smart cones” and high-visibility RFID tags deter thieves, while apps like Work Zone Safety report tampering in real-time. Fines in Texas can reach felony levels for bulk thefts. Community education campaigns emphasize the human cost, urging “If you see it, report it.”
Industry innovations for 2025 include eco-friendly, theft-resistant designs with quick-deploy mechanisms, projected to cut losses by 30%.
Tips to Protect Traffic Safety Equipment
Report Suspicious Activity: Snap a photo and alert local authorities via non-emergency lines.
For Workers: Use chained or weighted cones in high-risk areas; conduct nightly inventories.
Drivers: Slow down in zones—distracted speeding kills. Obey signage even if it seems “off.”
Parents and Educators: Teach kids theft’s consequences: Beyond fines, it’s a safety betrayal.
Communities: Advocate for funded patrols and anti-theft tech in budgets.
National Safety Council – Injury Facts: Work Zones (2025).
OSHA – Accident Reports (2020–2025).
CDC – Preventing Worker Injuries in Work Zones (updated 2025).
Door County Sheriff’s Office – Missing Cones Alert (2025).
Safe System Solutions – Cone Theft Snippet (2025).
Various X posts on traffic cone thefts (Sep–Oct 2025).
Disclaimer: Provided by Traffic Safety Guide for educational purposes. Stats are estimates from cited sources; always verify with local authorities. Prioritize safety—report tampering immediately!
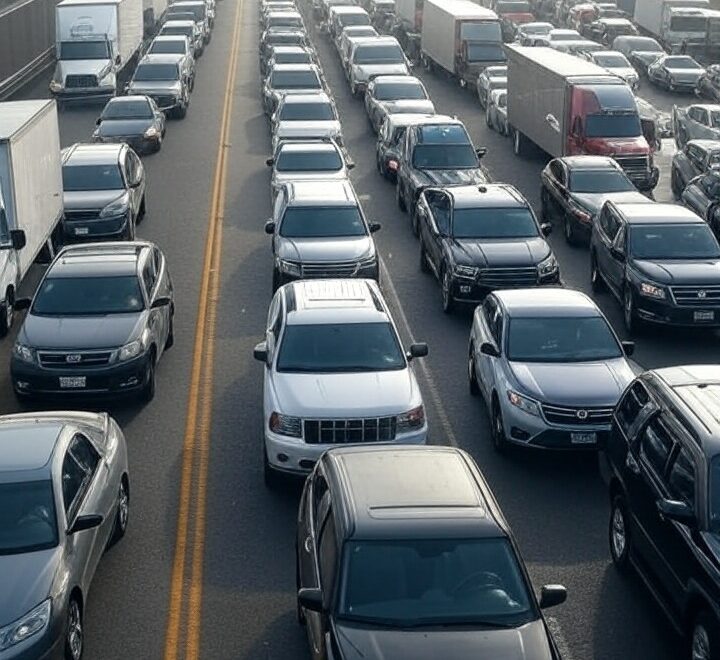
The 5 Worst Traffic Jams in U.S. History: Causes, Impacts & Lessons Learned
From blizzards and music festivals to mega-hurricanes, America’s worst gridlocks reveal as much about human behavior and emergency planning as they do about asphalt and automobiles. Below we examine five historic traffic nightmares, why they happened, how bad they became, and what changed afterward.
1. Chicago’s “Blizzard of ’67”
When: January 26–27, 1967
Where: Greater Chicago, IL
Why it happened: A record 23-inch snowfall in 29 hours overwhelmed snow-removal resources and stranded commuters.
Severity:≈ 20 000 abandoned cars + 1 100 buses; virtually every transport mode shut down.
Aftermath: Chicago created priority snow routes, expanded its salt-spread fleet, and formalized early-dismissal protocols.
2. Woodstock Festival Gridlock
When: August 15–17, 1969
Where: Bethel, NY (NY State Thruway & NY-17B)
Why it happened: An event planned for 50 000 drew nearly 500 000, swamping rural two-lane roads.
Severity: Thruway paralysis for 20 miles; 8-hour delays; many attendees abandoned vehicles and walked.
Aftermath: Modern mass-events now require multi-agency traffic plans, park-and-ride shuttles, and real-time media alerts.
3. Hurricane Rita Evacuation (Houston)
When: September 21–24, 2005
Where: I-45 & regional freeways, Houston, TX
Why it happened: A late, blanket evacuation order for 2.5 million residents; contra-flow lanes opened too late; fuel shortages.
Severity:100-mile bumper-to-bumper line; up to 36-hour trips in 100 °F heat; 107 deaths linked to evacuation conditions.
Fuel-staging contracts, clearer public messaging, roadside assistance.
Conclusion
The worst traffic jams in U.S. history weren’t simply roadway failures—they were planning and communication failures under stress. Each catastrophe rewrote the emergency-management playbook, reminding us that to keep people safe we must move them early, move them smart, and keep them informed.
References
Chicago History Museum. “The Blizzard of 1967.”
NOAA / NWS. “Chicago’s Largest Snowfall on Record.”
History.com. “Photos of History’s Worst Traffic Jams.”
The Columbian. “Five Myths About Woodstock.”
Houston Chronicle. “How Rita Anxiety Led to the Worst Gridlock in Houston History.”
CDC, Public Health Reports. “Lessons Learned from Hurricane Rita.”
The Atlantic. “How Two Inches of Snow Created a Traffic Nightmare in Atlanta.”
TransportationOps.org. “Emergency Shoulder Use During Hurricane Irma.”
Miami Herald. “Gov. Scott Orders Review of I-75 Evacuation Route After Irma.”
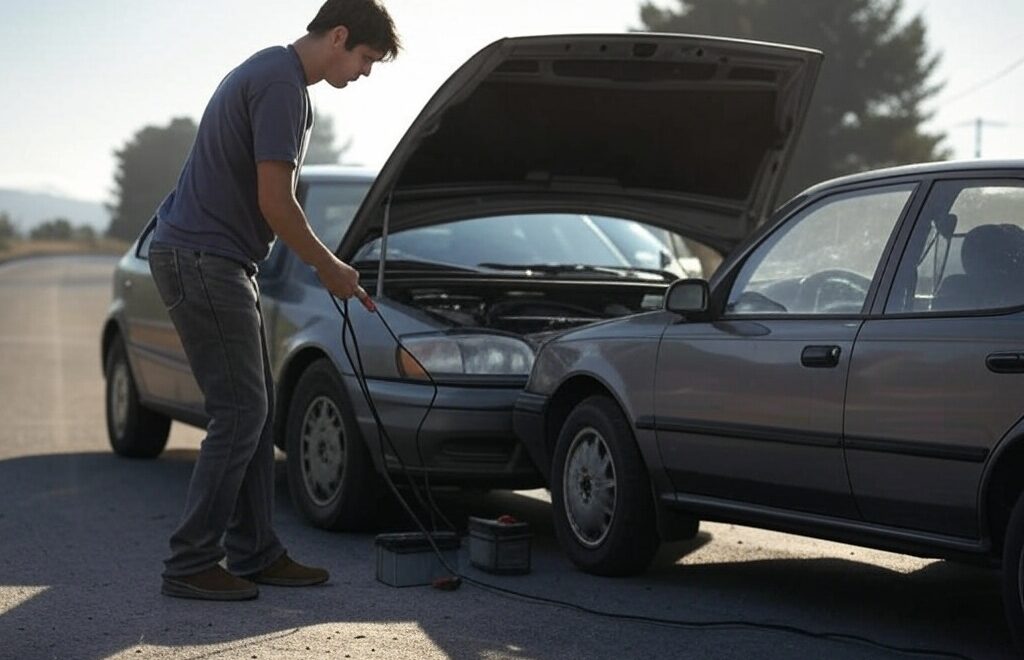
How to Safely Jump-Start a Car With a Dead Battery
How to Safely Jump-Start a Car With a Dead Battery
Jump-starting a car with a dead battery is a simple process when done correctly, but safety is critical to prevent injury or vehicle damage. This guide provides step-by-step instructions for using jumper cables or a portable jump starter, along with essential safety precautions and post-jump-start actions.
Items Needed for a Jump-Start
Ensure you have the following before starting:
Jumper Cables: Insulated, 10–20 feet, heavy-gauge for better reach and connection.
Donor Vehicle or Portable Jump Starter: A working car with a 12-volt battery or a charged portable jump starter.
Safety Gear: Work gloves (rubber, nitrile, or leather) and safety glasses to protect against sparks or acid.
Cleaning Supplies (Optional): Wire brush and rag to clean corroded battery terminals.
Emergency Extras (Optional): Flashlight for nighttime and vehicle owner’s manual for battery location or specific instructions.
Safety Precautions
Car batteries emit flammable hydrogen gas and high currents, posing risks of explosion or electrical damage. Follow these precautions:
Safe Positioning: Park vehicles close but not touching, away from traffic, with parking brakes engaged.
Power Off: Turn off ignitions, remove keys, and disable all accessories (lights, radio, etc.) in both vehicles.
Inspect Battery: Do not jump-start if the battery is cracked, leaking, bulging, frozen, or smells of sulfur, as it may be hazardous.
Protect Yourself: Wear gloves and safety glasses; remove metal jewelry to prevent shorts or burns.
Avoid Ignition Sources: No smoking or open flames near the battery due to explosive gas risks.
Correct Connections: Match 12-volt systems and connect positive (+) to positive, negative (–) to negative to avoid sparks or system damage.
Handle Cables Carefully: Prevent clamps from touching each other or metal surfaces until properly connected.
Follow Sequence: Connect and disconnect cables in the specified order to minimize spark risks near the battery.
Check Manual: Consult the owner’s manual for model-specific instructions or dedicated jump-start terminals.
Warning: Incorrect connections or damaged batteries can cause sparks, explosions, or electrical damage. Proceed with caution and stop if you notice battery damage.
Jump-Starting with Jumper Cables
Use a donor vehicle with a charged 12-volt battery. Follow these steps precisely:
Position Vehicles: Park the donor car nose-to-nose with the dead car, 1–2 feet apart, ensuring they don’t touch.
Prepare Vehicles: Turn off both engines, set transmissions to Park (or Neutral for manuals), engage parking brakes, and disable all accessories.
Locate Batteries: Open hoods, identify positive (+) and negative (–) terminals, and clean terminals if corroded.
Connect Red Cable to Dead Battery: Attach one red clamp to the dead battery’s positive (+) terminal securely.
Connect Red Cable to Donor Battery: Attach the other red clamp to the donor battery’s positive (+) terminal.
Connect Black Cable to Donor Battery: Attach one black clamp to the donor battery’s negative (–) terminal.
Ground Black Cable on Dead Car: Attach the other black clamp to an unpainted metal surface (e.g., engine bolt) on the dead car, away from the battery to reduce spark risk.
Start Donor Vehicle: Start the donor car and let it idle for 1–2 minutes, optionally revving to 1500–2000 RPM.
Start Dead Vehicle: Attempt to start the dead car. If it doesn’t start, wait 30 seconds and try again. If it fails after a few attempts, seek professional help.
Disconnect Cables: With the dead car running, remove cables in reverse order: black clamp from dead car’s ground, black clamp from donor’s negative, red clamp from donor’s positive, red clamp from dead car’s positive. Avoid clamp contact.
Close Hoods: Ensure the jumped car runs smoothly, then close hoods and remove safety gear.
Note: Keep the jumped car running to charge the battery. Do not turn it off immediately.
Jump-Starting with a Portable Jump Starter
A portable jump starter eliminates the need for a donor vehicle. Follow these steps:
Prepare Vehicle and Device: Place the jump starter on a stable surface, ensure the car is off, in Park/Neutral, with the parking brake on, and check the jump starter’s charge level.
Connect Red Clamp: Attach the jump starter’s red clamp to the battery’s positive (+) terminal.
Connect Black Clamp: Attach the black clamp to the battery’s negative (–) terminal or an unpainted engine ground, per the device’s instructions.
Activate Jump Starter: Turn on the jump starter or press its boost button, confirming a safe connection (e.g., green light).
Start Car: Attempt to start the car. If it fails, wait 30–60 seconds and try again, up to 3–5 times. If unsuccessful, seek professional help.
Disconnect Jump Starter: Turn off the jump starter, remove the black clamp, then the red clamp, avoiding contact between clamps or metal surfaces.
Close Hood: Store the jump starter and keep the car running to charge the battery.
Note: Recharge the jump starter after use and store it in a temperate environment to maintain its battery life.
After the Jump-Start
A successful jump-start is only the first step. Take these actions to prevent future issues:
Charge the Battery: Drive for 20–30 minutes or let the car idle to allow the alternator to recharge the battery. Driving is more effective than idling.
Avoid Immediate Shutdown: Do not turn off the engine until the battery has recharged to avoid needing another jump.
Test the Battery and Charging System: Have the battery and alternator tested at an auto shop to identify the cause of the failure.
Replace Battery if Needed: If the battery is old (3–5+ years) or fails testing, replace it to prevent future issues.
Monitor Performance: Watch for warning signs like dimming lights or a persistent battery light, indicating alternator or electrical issues.
Prevent Future Failures: Identify the cause (e.g., lights left on, old battery) and maintain the battery by keeping terminals clean and driving regularly, especially in cold weather.
Conclusion
Jump-starting a car is a valuable skill that can get you back on the road quickly. By prioritizing safety, following the correct connection sequence, and addressing the battery’s condition afterward, you can minimize risks and prevent future breakdowns. Keep jumper cables or a portable jump starter in your vehicle for emergencies, and always consult your owner’s manual for model-specific guidance.
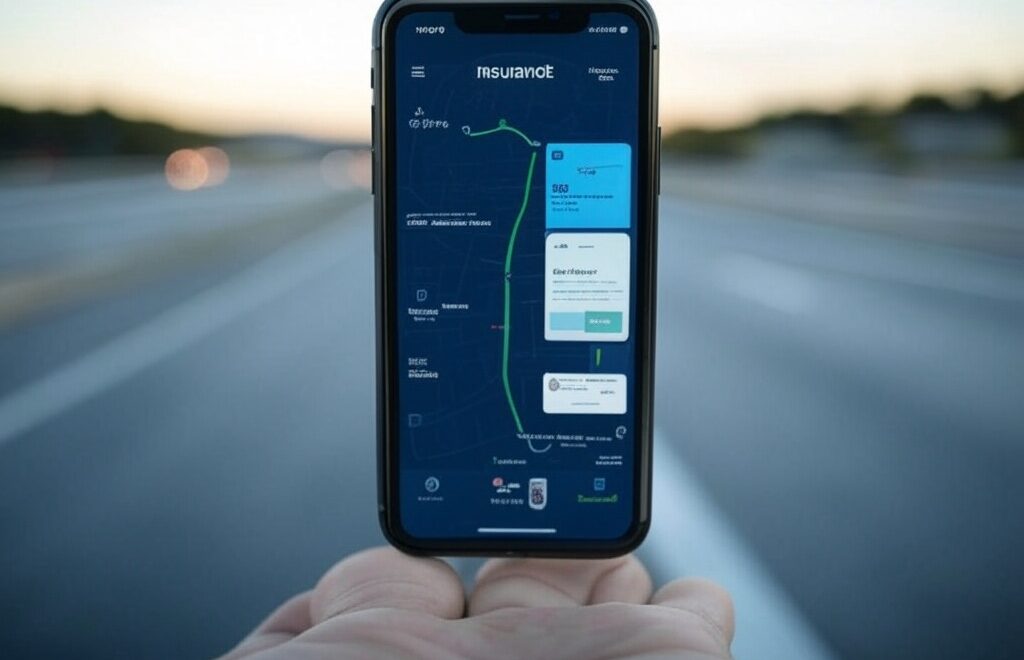
Insurance Company Mobile Apps That Track Driving: Are They a Good Idea?
Insurance Company Mobile Apps That Track Driving: Are They a Good Idea?
In recent years, insurance companies have embraced mobile apps to monitor driving behavior, offering usage-based insurance (UBI) programs that promise discounts for safe driving. These apps use telematics to track metrics like speed, braking, acceleration, and phone use. Programs such as Allstate’s Drivewise, Progressive’s Snapshot, and American Family’s DriveMyWay are gaining popularity. But are these apps a good idea? This article dives into the benefits, risks, and broader implications of letting insurers track your driving habits.
The Promise of Usage-Based Insurance
UBI apps aim to personalize premiums by collecting real-time driving data. Unlike traditional insurance, which relies on factors like age or location, telematics rewards safe habits. For instance, Allstate’s Drivewise tracks braking, speed, and time of day, offering discounts up to 40% (Allstate, 2025). Similarly, American Family’s DriveMyWay monitors phone use and nighttime driving, with potential savings of up to 20% (American Family Insurance, 2025).
For cautious drivers, this can mean real savings. These apps also provide feedback, acting like a driving coach to improve habits, such as reducing sudden stops. Insurers claim UBI reduces accident rates and fraud, potentially stabilizing premiums industry-wide (Insurance Information Institute, 2024).
The Privacy Trade-Off
Privacy is a major concern. These apps require access to GPS, accelerometers, and sometimes background data, tracking your location and habits constantly. While insurers like Progressive state they don’t share data unless required (Progressive, 2025), vague terms leave room for doubt. Some apps, tied to Allstate-owned Arity, have faced scrutiny for collecting data via unrelated services like GasBuddy and selling driving scores (Consumer Reports, 2024).
Data security is another risk. A breach could expose your routines, and app data might be used in accident disputes, potentially misinterpreting defensive driving as reckless. A 2025 Texas lawsuit against Allstate alleged unauthorized data collection led to unfair premium hikes (Texas Department of Insurance, 2025).
Financial Risks and Unfair Assessments
While discounts are appealing, outcomes vary. Safe drivers may save, but others could face rate hikes for minor infractions like occasional speeding. In regions like Ontario, insurers can now raise premiums based on telematics (Financial Services Regulatory Authority of Ontario, 2025). Algorithms lack transparency, and urban drivers may be penalized for frequent stops, while rural drivers skate by.
Apps can also misinterpret data, flagging passenger trips or cycling as driving. Without context—like another driver’s recklessness—scores may unfairly reflect risk, frustrating users who see little reward for their efforts.
The Broader Impact
UBI could make insurance fairer by focusing on behavior over demographics. A 2018 survey found 74% of Canadians were open to tracking for personalized rates (Canadian Automobile Association, 2018). However, low-income drivers, who may work odd hours or navigate congested areas, could be disproportionately flagged, raising equity concerns.
Psychologically, constant monitoring can feel intrusive, turning driving into a test. Some users report stress from gaming the system, only to see minimal savings. One driver abandoned their app after it flagged “dangerous” turns on a winding road (Reddit, 2024).
Are They a Good Idea?
It depends. Confident, low-mileage drivers comfortable with data sharing might benefit from programs like Nationwide’s SmartRide or Geico’s DriveEasy, with discounts up to 50% (Nationwide, 2025). But if privacy matters more, or you drive in tough conditions, the risks—rate hikes, data misuse, or unfair claims—may outweigh savings.
Before enrolling:
Read the Terms: Know what data is collected and if you can opt out penalty-free.
Test First: Try apps like Allstate’s TESTDrivewise to check your score.
Explore Alternatives: Look for discounts based on credit or history instead.
Limit Access: Disable unnecessary permissions to reduce data collection.
The Road Ahead
Regulations are evolving. States like California are tightening data transparency rules, and a federal privacy bill is under review (U.S. Congress, 2025). For now, drivers must weigh the trade-offs. UBI apps offer savings and safer roads but come with risks. Choose wisely—your data and wallet are at stake.
Should You Go to Court When You Get a Speeding Ticket?
Should You Go to Court When You Get a Speeding Ticket?
Getting a speeding ticket can leave you frustrated and unsure of what to do next. Should you pay the fine and move on, or take your case to court? For most people, the decision isn’t obvious. To help you decide, we’ve gathered insights from trusted organizations about when fighting a ticket makes sense—and when it might not.
Why You Might Fight a Speeding Ticket
Challenging a ticket in court can sometimes lead to better outcomes than simply paying up. Here’s what experts say about the benefits:
Keep Your Record Clean: Paying a ticket often means admitting guilt, which can add points to your driving record and raise insurance rates. The American Automobile Association (AAA) notes that fighting a ticket gives you a chance to avoid points, especially if you have a clean record or a strong defense.
Chance for Dismissal or Reduction: Tickets can be dismissed if the issuing officer doesn’t show up or if there’s an issue, like a faulty radar device. Nolo, a respected legal resource, explains that judges may reduce fines or change a ticket to a non-moving violation, which doesn’t impact your insurance.
Avoid Harsh Penalties: For serious violations—like speeding 20 mph over the limit—court could prevent license suspension or hefty fines. The National Highway Traffic Safety Administration (NHTSA) highlights that contesting severe tickets can help mitigate long-term consequences.
Why Paying the Fine Might Be Better
Not every ticket is worth fighting. Experts point out situations where paying up could be the smarter choice:
Low Stakes: If it’s your first ticket in years and the fine is small, the hassle of court might not be worth it. The Oregon State Bar advises that minor tickets with minimal consequences are often best resolved by paying or taking traffic school.
Weak Defense: Without evidence—like photos, witnesses, or proof of radar errors—winning in court is tough. FindLaw warns that cases often hinge on the officer’s word, making it hard to succeed without solid proof.
Time and Costs: Court requires time off work, travel, and sometimes lawyer fees. The California Courts system notes that if the fine is affordable and points won’t hurt your record, paying may save you more than fighting.
Key Factors to Weigh
Before deciding, experts suggest considering these points:
Your Driving Record: Multiple tickets or points could mean bigger risks, like suspension. A clean record gives you more flexibility to pay.
Ticket Severity: Minor speeding (e.g., 5-10 mph over) carries lighter consequences than reckless driving charges.
Evidence: Can you prove the ticket was unfair, like showing a hidden speed limit sign?
Resources: Do you have the time and money to go to court, including potential legal help?
Other Options to Explore
If court feels like too much but you don’t want to pay outright, experts highlight alternatives:
Traffic School: The Texas Department of Licensing and Regulation says completing a defensive driving course can often dismiss a ticket or remove points.
Prosecutor Negotiation: Nolo suggests talking to prosecutors before court to reduce charges, especially if you agree to steps like traffic school.
Payment Plans: For financial strain, some courts offer installment plans or community service, per the California Courts.
What Experts Advise
So, should you go to court? It depends. The AAA recommends fighting if you have a strong case, face serious penalties, or risk losing your license. But for minor tickets with little impact, Nolo and FindLaw suggest paying or pursuing traffic school to save time and stress.
To make the best choice:
Check your ticket for details like the violation code and court date.
Look up your state’s traffic laws online or at your local DMV.
Consider a quick chat with a traffic lawyer for advice tailored to your case.
As Nolo puts it, a speeding ticket doesn’t have to haunt you forever. By weighing expert advice and your situation, you can choose the path that keeps your record—and wallet—as safe as possible.
Sources:
– American Automobile Association (AAA). “How to Handle a Traffic Ticket.”
– Nolo. “Fighting Your Traffic Ticket: When It Makes Sense to Go to Court.”
– National Highway Traffic Safety Administration (NHTSA). “Traffic Safety Facts: Speeding.”
– Oregon State Bar. “Traffic Violations and Court Options.”
– FindLaw. “How to Fight a Speeding Ticket in 4/8/2024.”
– California Courts. “Paying or Contesting Traffic Tickets.”
– Texas Department of Licensing and Regulation. “Defensive Driving Course Information.”
Is the Rear Driver Always at Fault in a Rear-End Collision?
Rear-end collisions are among the most frequent car accidents, making up nearly 29% of all crashes according to the AAA Foundation for Traffic Safety. A common assumption is that the rear driver is always at fault—a belief rooted in traffic laws across all 50 states that require maintaining a safe following distance. But this isn’t an ironclad rule. While the rear driver often bears the blame, fault hinges on specific circumstances, state laws, and exceptions like brake checking or multi-car pileups. This article, brought to you by Traffic Safety Guide, explores how fault is determined in rear-end collisions, why the rear driver is typically (but not always) at fault, notable exceptions, and how state laws on insurance and negligence affect outcomes. A comprehensive table compares these laws across all 50 states to help you understand what to expect in your area.
Why the Rear Driver Is Often Presumed at Fault
The Duty to Maintain a Safe Distance
In most rear-end collisions, the trailing driver is presumed at fault because every state imposes a duty to leave enough space to stop safely. Traffic laws universally require drivers to follow at a distance that’s “reasonable and prudent” given the speed, traffic, and road conditions—often referred to as the “assured clear distance” or safe-following-distance rule. For example, if the car in front brakes suddenly, the rear driver should have enough room to stop without colliding. Failing to do so typically signals negligence on the rear driver’s part.
The Rear-End Doctrine
This duty underpins a legal concept called the rear-end doctrine, which presumes the rear driver was negligent. Police and insurance adjusters often start with this assumption unless evidence suggests otherwise. In New York, for instance, courts have ruled that a rear-end collision with a stopped vehicle establishes a presumption of negligence against the rear driver. The rear driver must then provide a non-negligent explanation—such as the front driver creating an unavoidable hazard—to shift or share blame.
Exceptions: When the Rear Driver Might Not Be Fully at Fault
While the rear driver is often held accountable, several exceptions can shift fault partially or entirely to the front driver or another party. Here are the key scenarios:
Brake Checking or Sudden Unnecessary Stops
If the lead driver slams on their brakes without a valid reason—often as an aggressive reaction to a tailgater (known as brake checking)—they may be deemed negligent. Brake checking is reckless and dangerous, potentially making the front driver fully or partially at fault. For example, if a lead driver brake-checks on a highway, causing a rear-end crash, the rear driver might not be held fully liable if evidence (like dashcam footage) shows the front driver’s actions were intentional.
Unsafe Lane Changes (Cutting In Front)
When a car merges or cuts in front of you and immediately slows or stops, leaving no time to react, the front driver’s improper lane change can make them at fault. Drivers have a duty to change lanes safely without endangering others. For instance, if a driver darts into your lane during heavy traffic and brakes abruptly, insurers may assign blame to them for creating the hazard, reducing the rear driver’s liability.
Vehicle Malfunctions (Brake Lights Out or Mechanical Failures)
Sometimes, the rear driver can’t avoid a crash due to the lead vehicle’s failure to provide proper warning. If the front car’s brake lights aren’t working, the rear driver might not realize the car is stopping. Similarly, a sudden mechanical failure—like a tire blowout or brake failure—can shift fault. In these cases, the rear driver’s liability may be reduced if they couldn’t reasonably avoid the collision due to the front driver’s vehicle issues.
Multi-Car Pileups (Chain-Reaction Crashes)
In multi-vehicle rear-end crashes, such as freeway pileups, the initial cause often lies with a driver further back. If you were pushed into the car in front of you by another vehicle behind you, you might not be at fault. Blame typically falls on the driver who started the chain reaction—often the rearmost vehicle that failed to stop. These cases can be complex, with fault apportioned among multiple drivers based on each collision in the chain.
The Role of Evidence
Evidence is crucial in proving these exceptions. Dashcam footage, witness statements, vehicle telematics, or crash reconstruction can demonstrate that “I was pushed into the car in front by another vehicle” or “The lead driver slammed their brakes on purpose.” Such evidence can help the rear driver avoid full liability or share fault with others.
Fault vs. No-Fault Insurance Systems: How Claims Are Handled
Understanding Fault and Insurance
Determining fault in a rear-end collision is distinct from how insurance claims are processed. Most states are “fault” states (also called tort liability states), where the at-fault driver’s liability insurance covers the other party’s damages. However, 12 states use a no-fault system, where each driver’s insurance pays for their medical injuries through Personal Injury Protection (PIP) coverage, regardless of fault. States like Florida, Michigan, New York, New Jersey, and Pennsylvania are no-fault, meaning minor injury claims are first handled by each driver’s PIP coverage.
Why Fault Still Matters in No-Fault States
Even in no-fault states, fault isn’t irrelevant. It determines who pays for property damage (like vehicle repairs) and injuries that exceed PIP limits or meet a severity threshold (e.g., permanent injury). No-fault states often restrict lawsuits for bodily injury unless injuries are serious or medical costs surpass a certain amount. In significant crashes, the at-fault driver’s insurance remains liable for damages beyond PIP. So, if you’re the rear driver and at fault, your liability insurance will likely cover damages in both fault and no-fault states—the difference is that in a no-fault state, the other driver’s minor injury claims might be paid by their PIP first.
Comparative vs. Contributory Negligence: How States Share Fault
The Two Main Approaches
When both drivers are negligent to some degree, state laws determine how fault is shared using either comparative or contributory negligence rules:
Contributory Negligence (Few States): In states like Alabama, Maryland, North Carolina, Virginia, and the District of Columbia, if you’re even 1% at fault, you can’t recover damages. This harsh rule means that if the front driver contributed to the crash (e.g., by stopping suddenly in an unsafe manner), they might recover nothing, even if the rear driver was mostly at fault. For example, if a front driver in Virginia brake-checks and is found 10% at fault, they could be barred from recovering damages despite the rear driver’s 90% fault.
Comparative Negligence (Most States): Most states (45) use comparative negligence, where damages are reduced by your percentage of fault:
Pure Comparative Negligence: You can recover damages regardless of your fault percentage, reduced proportionally. For instance, in California, a driver 80% at fault can still recover 20% of their damages. About a dozen states, including California, New York, and Louisiana, follow this rule.
Modified Comparative Negligence: You can recover only if your fault is below a threshold (50% or 51%):
51% Bar: Recover if 50% or less at fault (e.g., Texas, Illinois). If both drivers are 50/50 at fault, each can recover 50% of their damages.
50% Bar: Recover if 49% or less at fault; 50% or more bars recovery (e.g., Georgia, Tennessee). If fault is 50/50, neither recovers.
A Unique Case: South Dakota
South Dakota uses a “slight vs. gross” negligence rule, where a plaintiff can recover only if their fault is “slight” compared to the defendant’s “gross” negligence. In rear-end cases, the rear driver’s fault is often considered “gross” (e.g., tailgating), while the front driver’s fault might be “slight” (e.g., a sudden but justified stop), allowing the front driver to recover reduced damages.
Practical Impact on Rear-End Collisions
In comparative negligence states, fault can be shared. For example, if the rear driver is 80% at fault for tailgating but the front driver is 20% at fault for brake-checking, the front driver can recover 80% of their damages in a pure comparative state like California. In a modified comparative state like Texas (51% bar), the front driver can still recover 80%, but the rear driver (over 50% at fault) recovers nothing. In a contributory negligence state like Maryland, that 20% fault would bar the front driver from recovering anything.
State-by-State Comparison of Rear-End Collision Liability Laws
The table below provides a state-by-state breakdown of insurance systems (fault vs. no-fault), negligence rules (comparative vs. contributory), and notable laws or precedents affecting rear-end collision liability. Use this to understand how your state might handle a rear-end accident.
State
Insurance System
Negligence Rule
Notable Law/Precedent on Rear-End Liability
Alabama
Fault
Contributory Negligence
Pure contributory negligence; any fault by the lead driver bars recovery. Rear driver presumed negligent for unsafe following distance.
Alaska
Fault
Pure Comparative Negligence
Pure comparative negligence; rear driver usually at fault unless front driver contributed.
50% bar; rear driver typically at fault unless lead driver’s actions were equally negligent.
California
Fault
Pure Comparative Negligence
Pure comparative negligence; rear driver presumed negligent but can rebut with evidence of front driver’s fault (e.g., brake checking).
Colorado
Fault
Modified Comparative (50% bar)
50% bar; rear driver at fault for violating “assured clear distance” unless front driver equally at fault.
Connecticut
Fault
Modified Comparative (51% bar)
51% bar; rear driver assumed negligent but can recover if 50% or less at fault.
Delaware
Fault
Modified Comparative (51% bar)
51% bar; rear driver typically at fault for following too closely.
Florida
No-Fault
Modified Comparative (51% bar)
No-fault state with 51% bar; rear driver presumed negligent but fault can be split if lead driver was negligent.
Georgia
Fault
Modified Comparative (50% bar)
50% bar; rear driver usually at fault for tailgating; front driver must be less than 50% at fault to recover.
Hawaii
No-Fault
Modified Comparative (51% bar)
No-fault with 51% bar; rear driver presumed at fault but can recover if 50% or less at fault.
Idaho
Fault
Modified Comparative (50% bar)
50% bar; rear driver at fault for not maintaining safe distance unless front driver equally at fault.
Illinois
Fault
Modified Comparative (51% bar)
51% bar; rear driver presumed negligent for not following at a safe distance.
Indiana
Fault
Modified Comparative (51% bar)
51% bar; rear driver typically at fault unless front driver’s fault exceeds 50%.
Iowa
Fault
Modified Comparative (51% bar)
51% bar; rear driver at fault for not keeping clear stopping distance.
Kansas
No-Fault
Modified Comparative (51% bar)
No-fault with 51% bar; rear driver usually at fault; front driver can recover if 50% or less at fault.
Kentucky
No-Fault (Choice)
Pure Comparative Negligence
Choice no-fault with pure comparative negligence; fault can be split in any proportion.
Louisiana
Fault
Pure Comparative Negligence
Pure comparative negligence; rear driver presumed negligent but fault can be apportioned (La. R.S. 32:81).
Maine
Fault
Modified Comparative (50% bar)
50% bar; rear driver typically at fault; front driver must be less than 50% at fault to recover.
Maryland
Fault
Contributory Negligence
Contributory negligence; any fault by lead driver bars recovery.
Massachusetts
No-Fault
Modified Comparative (51% bar)
No-fault with 51% bar; rear driver usually at fault unless front driver exceeds 50% fault.
Michigan
No-Fault
Modified Comparative (51% bar)
No-fault with 51% bar; rear driver presumed negligent; fault matters for non-economic damages.
Minnesota
No-Fault
Modified Comparative (51% bar)
No-fault with 51% bar; rear driver typically at fault; front driver can recover if 50% or less at fault.
Mississippi
Fault
Pure Comparative Negligence
Pure comparative negligence; fault can be split, rear driver usually at fault.
Missouri
Fault
Pure Comparative Negligence
Pure comparative negligence with rear-end doctrine; rear driver must rebut negligence presumption.
Montana
Fault
Modified Comparative (51% bar)
51% bar; rear driver presumed at fault; front driver can recover if 50% or less at fault.
Nebraska
Fault
Modified Comparative (50% bar)
50% bar; rear driver typically at fault; front driver must be less than 50% at fault to recover.
Nevada
Fault
Modified Comparative (51% bar)
51% bar; rear driver presumed at fault; front driver can recover if 50% or less at fault.
New Hampshire
Fault
Modified Comparative (51% bar)
51% bar; rear driver usually at fault; front driver can recover if 50% or less at fault.
New Jersey
No-Fault (Choice)
Modified Comparative (51% bar)
Choice no-fault with 51% bar; rear driver presumed at fault; front driver can recover if 50% or less at fault.
New Mexico
Fault
Pure Comparative Negligence
Pure comparative negligence; fault can be split in any ratio.
New York
No-Fault
Pure Comparative Negligence
No-fault with pure comparative negligence; rear driver presumed negligent but can rebut with evidence.
North Carolina
Fault
Contributory Negligence
Contributory negligence; any fault by lead driver bars recovery.
North Dakota
No-Fault
Modified Comparative (50% bar)
No-fault with 50% bar; rear driver typically at fault; front driver can recover if less than 50% at fault.
Ohio
Fault
Modified Comparative (51% bar)
51% bar; rear driver presumed at fault for violating “assured clear distance” rule.
Oklahoma
Fault
Modified Comparative (51% bar)
51% bar; rear driver presumed negligent; front driver can recover if 50% or less at fault.
Oregon
Fault
Modified Comparative (51% bar)
51% bar; rear driver typically at fault; front driver can recover if 50% or less at fault.
Pennsylvania
No-Fault (Choice)
Modified Comparative (51% bar)
Choice no-fault with 51% bar; rear driver presumed at fault; front driver can recover if 50% or less at fault.
Rhode Island
Fault
Pure Comparative Negligence
Pure comparative negligence; fault can be apportioned, rear driver usually at fault.
South Carolina
Fault
Modified Comparative (51% bar)
51% bar; rear driver presumed at fault; front driver can recover if 50% or less at fault.
South Dakota
Fault
“Slight-Gross” Comparative Negligence
Unique slight vs. gross rule; rear driver typically at fault unless front driver’s fault is more than slight.
Tennessee
Fault
Modified Comparative (50% bar)
50% bar; rear driver usually at fault; front driver must be less than 50% at fault to recover.
Texas
Fault
Modified Comparative (51% bar)
51% bar; rear driver presumed at fault for violating “assured clear distance” rule (Texas Transportation Code § 545.062).
Utah
No-Fault
Modified Comparative (50% bar)
No-fault with 50% bar; rear driver typically at fault; front driver can recover if less than 50% at fault.
Vermont
Fault
Modified Comparative (51% bar)
51% bar; rear driver presumed at fault; front driver can recover if 50% or less at fault.
Virginia
Fault
Contributory Negligence
Contributory negligence; any fault by lead driver bars recovery.
Washington
Fault
Pure Comparative Negligence
Pure comparative negligence; fault can be split, rear driver usually at fault.
West Virginia
Fault
Modified Comparative (51% bar)
51% bar; rear driver presumed at fault; front driver can recover if 50% or less at fault.
Wisconsin
Fault
Modified Comparative (51% bar)
51% bar; rear driver presumed at fault; front driver can recover if 50% or less at fault.
Wyoming
Fault
Modified Comparative (51% bar)
51% bar; rear driver presumed at fault; front driver can recover if 50% or less at fault.
Disclaimer: This article is for informational purposes only and does not constitute legal advice. Laws regarding fault in rear-end collisions vary by state and can change over time. Always consult your local and state laws, as well as your insurance company, to understand how fault and liability may apply in your specific situation.
Sources
The information in this article is drawn from state statutes, case law on negligence and insurance systems, and traffic laws like the Texas Transportation Code § 545.062, which mandates safe following distances. Courts in many states recognize a rebuttable presumption of rear-driver negligence in rear-end crashes. No-fault state details are based on insurance law references, and negligence standards are derived from comparative fault surveys and state-specific legal precedents. For more on safe driving, check out resources from the NHTSA.
The rear driver isn’t always at fault in a rear-end collision, but they often are due to the universal duty to maintain a safe distance. Exceptions like brake checking, unsafe lane changes, vehicle malfunctions, or chain reactions can shift or share blame. State laws on negligence and insurance—whether contributory or comparative, fault or no-fault—further shape outcomes. Documenting the scene with dashcams or witness statements can help prove your case. Above all, safe driving and proper following distances are your best defense against rear-end crashes and the legal battles that may follow. For more traffic safety tips and resources, visit the Traffic Safety Guide to stay informed and prepared on the road.
The History of Traffic Tickets – Traffic Safety Guide
The History of Traffic Tickets: From Horseback to Highways
Traffic tickets, those dreaded slips of paper handed out by law enforcement, are a familiar part of modern life for drivers worldwide. But their origins are tied to the evolution of transportation itself, reflecting society’s attempts to regulate an increasingly mobile world. From the dusty roads of the 19th century to today’s high-speed highways, the history of traffic tickets is a fascinating journey through innovation, law, and human behavior.
Early Days: Regulating the Roads Before Cars
Before the automobile, traffic laws existed in a rudimentary form. In the 1800s, cities like London and New York were bustling with horse-drawn carriages, pedestrians, and the occasional bicycle. Rules were informal, often enforced by local constables who relied on common sense rather than written codes. For example, in 1868, London introduced the world’s first traffic light—a gas-powered semaphore signal—to manage horse-drawn chaos near Parliament. Violations, though, were rare and usually settled with a stern warning or a small fine paid on the spot.
The concept of a “ticket” as we know it didn’t exist yet. Instead, offenders might be summoned to court or fined directly by an officer. These early regulations focused on preventing collisions and keeping public spaces orderly, but enforcement was inconsistent, and record-keeping was minimal.
The Automobile Revolution and the Birth of Traffic Tickets
The invention of the automobile in the late 19th century changed everything. Karl Benz’s 1886 Motorwagen was just the beginning; by the early 1900s, cars were multiplying on roads designed for slower, simpler traffic. With speed came danger—and the need for control.
The first recorded traffic ticket in the United States is often credited to New York City in 1899. A cab driver named Jacob German was arrested for speeding down Lexington Avenue at a blistering 12 miles per hour in an electric taxi. There was no standardized “ticket” yet; German was hauled off to jail, and the incident made headlines as a curiosity. However, this event signaled a shift: motorized vehicles demanded a new approach to law enforcement.
By 1901, New York state introduced the first driver’s license requirement, and other regions followed suit. Traffic codes began to formalize, with speed limits, right-of-way rules, and restrictions on reckless driving. The “ticket” as a written citation emerged as a practical solution. Officers could issue a fine or court summons without immediate arrest, streamlining enforcement. In 1904, Ohio issued what some consider the first modern traffic ticket to a driver named Harry Myers, caught speeding in Dayton. The fine? A modest $5.
The Rise of the Ticket System
As car ownership exploded in the 1920s—thanks to Henry Ford’s affordable Model T—traffic violations became a daily headache for cities. Police departments established dedicated traffic units, and the ticket system matured. Citations were handwritten, detailing the offense, fine amount, and payment instructions. Speeding was the most common violation, but tickets also covered parking infractions, running stop signs (introduced in 1917), and ignoring the growing number of traffic signals.
The 1930s and 1940s saw further refinements. Radar guns, invented during World War II, were adapted for civilian use by the late 1940s, giving officers a precise tool to catch speeders. Tickets became standardized forms, often in duplicate or triplicate, with carbon copies for record-keeping. Fines varied widely by jurisdiction, but they were increasingly seen as both a deterrent and a revenue source for local governments—a dual role that remains controversial today.
Mid-20th Century: Tickets Go Mainstream
Post-war prosperity in the 1950s and 1960s fueled a boom in car culture, especially in the United States. Highways expanded, suburbs grew, and traffic tickets became a routine part of driving life. The introduction of the interstate highway system in 1956 brought federal standards, but enforcement remained local. Tickets evolved with technology: typewriters replaced handwriting, and by the 1970s, some departments experimented with early computer systems to track violations.
Cultural attitudes toward tickets shifted too. They became fodder for jokes, cartoons, and even songs—like Chuck Berry’s 1960 hit “No Money Down,” which mentions dodging a fine. Yet they also sparked resentment, with drivers grumbling about “speed traps” and overzealous cops.
Modern Era: Digital Tickets and Beyond
The late 20th and early 21st centuries brought traffic enforcement into the digital age. By the 1990s, handheld printers allowed officers to issue tickets on the spot with barcodes and database integration. Red-light cameras and speed cameras, first widely used in Europe, spread to the U.S., automating ticketing and igniting debates over privacy and fairness.
Today, traffic tickets are a blend of old and new. Officers still patrol with radar guns and notepads, but electronic citations can be emailed or paid online. In some places, artificial intelligence analyzes traffic patterns to optimize enforcement. Fines have ballooned—sometimes reaching hundreds of dollars—reflecting both inflation and municipalities’ reliance on ticket revenue.
A Lasting Legacy
From Jacob German’s 12-mph joyride to a modern driver nabbed by a drone-mounted camera, traffic tickets have evolved alongside transportation itself. They’re a testament to society’s ongoing struggle to balance freedom, safety, and order on the roads. Love them or hate them, traffic tickets are here to stay—proof that even in the age of self-driving cars, humans (and their machines) still need a nudge to follow the rules.
Published on Traffic Safety Guide, your go-to resource for staying safe and informed on the roads.
The Psychology of Road Rage: Triggers and Solutions for Safer Roads
The Psychology of Road Rage: Unpacking Triggers for Safer Roads
Picture this: You’re driving along, enjoying your favorite tune, when a car cuts you off, forcing a hard brake. Your pulse spikes, fists tighten, and anger surges. For a moment, you’re tempted to tailgate or honk like mad. This is road rage—a driving phenomenon as old as cars themselves, yet increasingly critical in our congested world. What flips a calm driver into a furious one? And how can understanding these psychological triggers make roads safer?
What Sparks Road Rage?
Road rage is an emotional outburst tied to driving, from mild irritation (think excessive honking) to dangerous aggression (like chasing another car). Psychologists pinpoint a mix of triggers.
Stress amplification tops the list. Driving often piles on time pressure or personal woes. A 2019 study found stressed drivers are 30% more likely to act aggressively. The car becomes a pressure cooker—any traffic slight feels personal.
Anonymity fuels it too. In your “vehicular cocoon,” social norms fade. Without face-to-face accountability, inhibitions drop. You’d never yell at someone in a store line—why’s it okay behind the wheel?
Perceived injustice stokes the fire. A cut-off or reckless weave feels unfair, tapping into a primal need for justice. Add traffic congestion—linked to a 15% rise in aggressive driving in cities—and tempers flare.
The Mind Behind Aggressive Driving
Why do some shrug off a near-miss while others rage? Personality plays a role. People prone to anger are twice as likely to lash out on the road. Narcissists, feeling entitled to the asphalt, explode when challenged.
Context matters too. Sleep deprivation dulls impulse control, while cultural norms shape reactions—Japan’s collectivist vibe sees less rage than the U.S.’s individualistic streak.
The Ripple Effect of Road Rage
Road rage isn’t harmless venting. The National Highway Traffic Safety Administration (NHTSA) estimates aggressive driving contributes to 56% of U.S. fatal crashes yearly—over 20,000 deaths. One enraged driver can trigger chaos: tailgating, sudden braking, or swerves. It erodes road trust, turning highways into battlegrounds.
Source: NHTSA, “Aggressive Driving Statistics,” accessed April 3, 2025.
Taming Road Rage: Psychological Solutions
Understanding triggers offers a path to safer roads. Here’s how:
Self-Awareness Campaigns: Teach drivers to check their stress before driving. California’s “Drive Mindful” cut rage incidents by 12% with breathing exercises.
Tech Buffers: Cars could detect tension—think sensors or calming playlists. Toyota’s 2024 concept reroutes to quieter roads.
Calming Road Design: Wider lanes and roundabouts reduce frustration. Dutch roundabouts slashed crashes by 40%.
Empathy Education: Sweden’s programs cut repeat offenses by 25% by teaching drivers to see others’ perspectives.
Cultural Shift: Ditch media glorifying revenge driving for PSAs promoting patience.
The Road Ahead for Traffic Safety
Road rage reflects our stressed, disconnected world. By decoding its psychology—from anonymity to injustice—we can craft smarter fixes. Imagine cars that soothe, roads that calm, and drivers who see humanity, not obstacles. Safer roads start in the mind—time to breathe before we accelerate.
What do you think—could these work where you drive? Got a local road rage twist to share?
The Impact of Automatic Speed and Red Light Cameras: Safety, Revenue, and State Adoption
The Impact of Automatic Speed and Red Light Cameras: Safety, Revenue, and State Adoption
Published: March 31, 2025
Automatic speed ticket and red light cameras have become a fixture in traffic enforcement across the United States, sparking debates over their effectiveness, financial implications, and ethical considerations. These automated systems, designed to capture violations such as speeding and running red lights, aim to enhance road safety by deterring dangerous driving behaviors. However, their widespread use has also raised questions about whether they truly improve safety or primarily serve as revenue-generating tools for municipalities and states. This article explores the evidence behind their effectiveness, their financial impact, and provides a comprehensive overview of their adoption across the U.S.
Do They Work?
The primary justification for installing automatic speed and red light cameras is to reduce traffic accidents and save lives. Research offers a mixed but generally supportive picture of their effectiveness, particularly when it comes to specific types of crashes.
Red light cameras target one of the most dangerous violations: running red lights, which often leads to severe “T-bone” or right-angle collisions. Studies consistently show that these cameras reduce such incidents. For instance, a Virginia study found a 67% decrease in drivers running red lights at camera-equipped intersections. National data from the Insurance Institute for Highway Safety (IIHS) supports this, noting that red light cameras decrease severe collisions, with a 2021 estimate of 1,109 fatalities linked to red light running—half of whom were pedestrians, cyclists, or occupants of other vehicles. A systematic review published in the British Medical Journal further concluded that speed cameras reduce fatal and serious injury crashes by 11% to 44%, while the UK Department for Transport reported a 22% drop in personal injury collisions and 42% fewer deaths or serious injuries at camera sites.
Speed cameras, meanwhile, address another leading cause of traffic fatalities: speeding, which contributed to 12,151 deaths in the U.S. in 2022, according to the National Highway Traffic Safety Administration (NHTSA). Evidence suggests they are effective at slowing drivers down. A 2024 report from the Fines and Fees Justice Center acknowledged that speed cameras reduce collisions by 20% to 37%, particularly in high-risk areas like school zones and work zones. Signs warning of camera enforcement further amplify this effect, encouraging compliance without necessarily issuing tickets.
However, the picture isn’t universally positive. Red light cameras, while reducing angle crashes, often increase rear-end collisions as drivers brake abruptly to avoid fines. A Houston study from 2003-2014 found that while total crashes dropped slightly after cameras were installed, rear-end accidents rose, offsetting some safety gains. Critics argue that this trade-off muddies their overall impact on driver safety. Additionally, the long-term behavioral change is questionable—fines mailed weeks later lack the immediacy needed to consistently deter violations, unlike physical road design changes such as roundabouts or longer yellow light timings, which have proven more effective in places like Fairfax County, Virginia (96% reduction in violations after extending yellow lights by 1.5 seconds).
In short, automatic cameras work to reduce specific dangerous behaviors and crash types, but their net safety benefit depends on context, implementation, and complementary measures. They are not a panacea, and their effectiveness can be overstated when revenue motives overshadow safety priorities.
Do They Generate Meaningful Revenue?
Revenue generation is a lightning rod in the debate over automatic cameras. Proponents argue that fines fund safety programs, while critics contend they turn drivers into cash cows for governments and private companies.
The financial haul can be substantial. In Illinois, red light cameras collected over $1.56 billion from 2008 to 2023, with Chicago alone accounting for $915.5 million. Chicago’s 169 speed cameras added another $102 million in 2023 from 1.56 million tickets. Maryland’s work zone speed cameras issued 335,888 citations in fiscal year 2023, generating $9.7 million, with fines set to rise from $40 to $250 by 2025. New York City’s red light camera program, expanded in 2024 to cover 10% of intersections, has been a steady revenue stream since 1994, though exact figures vary by year. In California, Rancho Cordova saw red light camera revenue soar from $73,000 to $742,000 between 2012 and 2016 after installing four cameras.
Yet, “meaningful” revenue is relative. For states or large cities, these sums are often a small fraction of total budgets. Florida collected $52 million from red light cameras across 76 jurisdictions in 2013, but this pales against its $100 billion-plus state budget. Texas, before banning red light cameras in 2019, directed excess revenue to trauma centers and transportation, suggesting a public benefit beyond profit. Conversely, smaller municipalities can become heavily reliant on camera income—Bedford Park, Illinois, issued 23 tickets per resident in 2022, raking in $8.3 million since 2008. Critics highlight cases like Crestwood, Illinois, where eight cameras in a town of 10,000 generated $13 million since 2016, pointing to a disproportionate burden on drivers.
Private companies like American Traffic Solutions (now Verra Mobility) and Redflex, often contracted to operate these systems, take a significant cut—sometimes up to 86% of profits, as noted in Arizona. This profit motive has fueled accusations of corruption, such as in Chicago, where a former official was jailed for bribery tied to camera contracts, or Oakbrook Terrace, where the ex-mayor admitted to kickbacks. Lockheed Martin’s contracts once prohibited cities like San Diego from adjusting yellow light times to maintain ticket flows, further stoking skepticism about safety-first claims.
While cameras undeniably generate revenue, their “meaningfulness” varies by jurisdiction. For some, it’s a vital funding source; for others, it’s a drop in the bucket overshadowed by ethical concerns and public backlash.
State Adoption of Automatic Cameras
The use of speed and red light cameras varies widely across the U.S., shaped by state laws, public opinion, and legislative trends. Below is a table detailing which states permit, restrict, or ban these systems as of March 31, 2025, based on available data and recent legislative updates.
Note: “Permitted” indicates state law allows local jurisdictions to use cameras, though adoption varies. “Banned” means a statewide prohibition exists. “No specific law” suggests no clear authorization or ban, often resulting in minimal use. Data reflects trends up to March 31, 2025, based on legislative updates from sources like GHSA, IIHS, and Land Line.
Conclusion
Automatic speed and red light cameras demonstrably reduce certain crashes—red light running and speeding-related incidents—saving lives in targeted scenarios. However, their safety benefits are tempered by increases in rear-end collisions and a reliance on fines that may not sustainably change behavior. Revenue generation is real and significant, especially for smaller municipalities, but it often comes with accusations of profiteering and inequity, disproportionately burdening low-income drivers. State adoption reflects this tension, with a patchwork of policies driven by safety goals, fiscal needs, and public resistance. Ultimately, while cameras can be part of a safety toolkit, engineering solutions like better road design may offer a more equitable and enduring path to safer streets.
Overview: Ancient Rome, at its height, had a population possibly exceeding one million residents. This large urban center faced challenges in managing the flow of carts, wagons, and pedestrians on narrow streets, prompting early forms of traffic regulation and safety measures. Below is a concise, well-researched overview of how the ancient Romans experienced and managed traffic and traffic safety in the city of Rome.
1. The Nature of Traffic in Ancient Rome
1.1 Rome as a Bustling Metropolis
By the 1st century BCE, Rome had grown into a vast city with a dense population. A city of that size naturally saw a great deal of activity:
Commerce and Trade: Goods flowed into Rome from all over the empire, requiring wagons and carts to transport merchandise.
Urban Mobility: People traversed the streets on foot or by horse-drawn vehicles, sedan chairs, or even on horseback.
Social and Civic Events: Major festivals, processions, and public ceremonies often caused large crowds and restricted normal traffic.
Although ancient Rome lacked modern automobiles, the movement of people and horse-drawn wagons often led to congestion reminiscent of today’s traffic jams.
1.2 Road Infrastructure
Rome’s famed road network extended throughout the empire, but the city streets themselves could be narrow and winding:
Paved Streets: Many major roads in Rome were paved with stone slabs, enabling relatively smoother travel compared to dirt surfaces.
Sidewalks and Drainage: In higher-status areas, elevated sidewalks and drainage systems helped keep pedestrians separate from carts.
These infrastructural innovations eased travel somewhat, but population growth often outstripped the city’s design, leading to high levels of congestion near markets, the Forum, and other busy districts.
2. Legal Restrictions and Attempts to Manage Traffic
2.1 Julius Caesar’s Traffic Regulations
One of the earliest known legal measures to address overcrowded streets came under Julius Caesar in the 1st century BCE:
Time Restrictions: Heavy wagons were prohibited from entering the city center during daylight hours, thereby reducing congestion for much of the day.
Exceptions: Certain vehicles, such as those belonging to high-ranking officials or the Vestal Virgins, were granted exemptions.
Caesar’s approach was designed to ease daytime traffic and improve mobility for ordinary citizens.
2.2 Other Imperial Era Edicts
Later emperors refined Caesar’s restrictions:
Limiting the Number of Carts: Authorities often restricted pack animals and wagons during peak hours, reducing noise and crowding.
Road Maintenance Laws: Aediles (magistrates in charge of public amenities) repaired roads and enforced weight limits on carts.
These measures illustrate official recognition of traffic congestion as a public safety issue.
3. Early Approaches to Traffic Safety
3.1 The Threats of Ancient Traffic
Even with slower vehicles, accidents were common:
Collisions: Narrow streets increased the likelihood of carts colliding with each other or with pedestrians.
Pedestrian Injuries: Minimal street lighting and a lack of standardized lanes exposed pedestrians to dangers from horses or wagons.
Road Hazards: Uneven pavement and obstructed roads led to trips, falls, and vehicle overturns.
3.2 Safety Measures
Although there were no traffic lights or modern speed limits, several practices enhanced safety:
Raised Sidewalks: Pedestrians were protected from wheels and hooves, and stepping stones provided a rudimentary crosswalk system.
Dedicated Routes and Times: Restricting certain vehicles to night deliveries was an early form of “road rationing,” reducing daytime crowding.
Use of Milestones: Along roads outside the city, milestones aided navigation and logistics, indirectly helping to prevent congestion.
Oversight by Aediles: Aediles could fine owners of carts in disrepair or vehicles overloaded beyond safe capacity.
4. Social and Cultural Factors Affecting Traffic Management
Several broader factors shaped how Romans managed traffic:
Status and Class: Elite Romans often traveled by litter (a carried sedan chair). This method could bypass some congestion but also create bottlenecks if accompanied by large retinues.
Public Events: Major festivals, triumphs, and religious observances temporarily banned non-essential traffic in certain areas, alleviating some congestion.
Nighttime Noise and Curfews: Many authors, such as Pliny the Younger, complained about carts rumbling through the streets at night, highlighting that shifting traffic to off-hours created new problems.
5. Evaluating Ancient Rome’s Traffic Measures
Rome’s strategies, while rudimentary by modern standards, demonstrate a clear effort to deal with a large city’s challenges:
Congestion Recognition: Time-based vehicle restrictions showed that Roman leadership saw traffic as an economic and social issue.
Basic Safety Infrastructure: Sidewalks, stepping stones, and penalties for poorly maintained carts offered early standards for public safety.
Centralized Regulation: The existence of officials like aediles indicates Rome’s commitment to organized urban management.
Balancing Commerce and Comfort: Restricting heavy traffic to off-peak hours helped maintain daytime flow but led to nighttime noise and occasional accidents.
Conclusion
Although ancient Romans did not face motorized vehicles or the vast fleet of cars we see today, the city’s dense population and many wagons, carts, and animals created notable congestion. Time-based restrictions, raised sidewalks, and continuous road maintenance all emerged as ways to manage the challenges of a bustling metropolis. These measures, though simple, represent a surprisingly forward-thinking approach to urban mobility and public safety—a testament to Rome’s enduring legacy of engineering and governance.