Monthly Archives

March 2025

red light camera
Traffic Facts

The impact of automatic speed and red light cameras on safety


The Impact of Automatic Speed and Red Light Cameras: Safety, Revenue, and State Adoption


The Impact of Automatic Speed and Red Light Cameras: Safety, Revenue, and State Adoption

Published: March 31, 2025

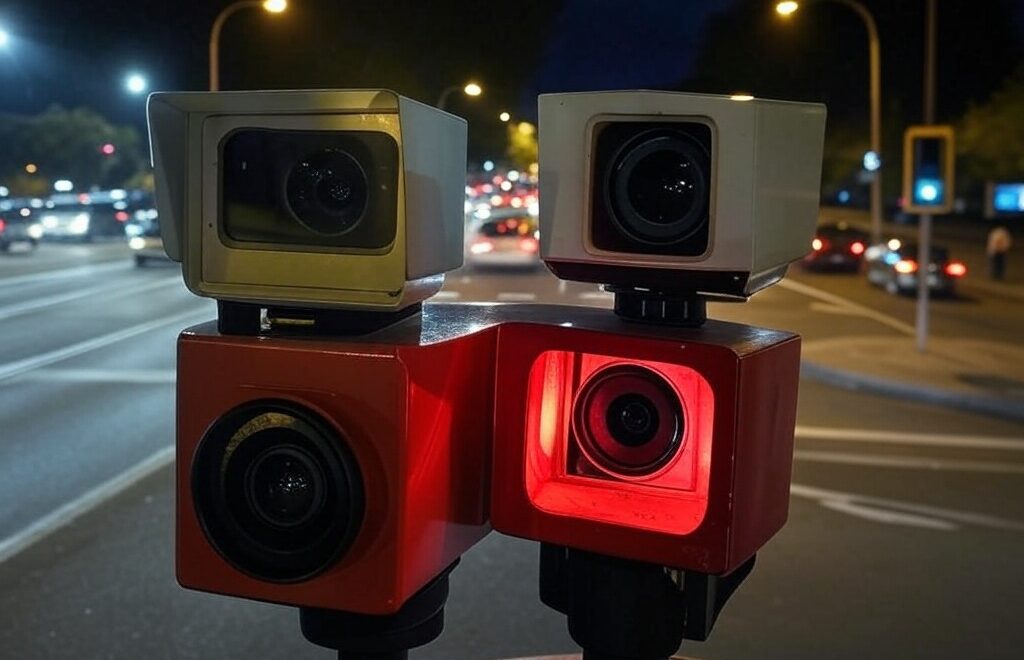
Automatic speed ticket and red light cameras have become a fixture in traffic enforcement across the United States, sparking debates over their effectiveness, financial implications, and ethical considerations. These automated systems, designed to capture violations such as speeding and running red lights, aim to enhance road safety by deterring dangerous driving behaviors. However, their widespread use has also raised questions about whether they truly improve safety or primarily serve as revenue-generating tools for municipalities and states. This article explores the evidence behind their effectiveness, their financial impact, and provides a comprehensive overview of their adoption across the U.S.

Do They Work?

The primary justification for installing automatic speed and red light cameras is to reduce traffic accidents and save lives. Research offers a mixed but generally supportive picture of their effectiveness, particularly when it comes to specific types of crashes.

Red light cameras target one of the most dangerous violations: running red lights, which often leads to severe “T-bone” or right-angle collisions. Studies consistently show that these cameras reduce such incidents. For instance, a Virginia study found a 67% decrease in drivers running red lights at camera-equipped intersections. National data from the Insurance Institute for Highway Safety (IIHS) supports this, noting that red light cameras decrease severe collisions, with a 2021 estimate of 1,109 fatalities linked to red light running—half of whom were pedestrians, cyclists, or occupants of other vehicles. A systematic review published in the British Medical Journal further concluded that speed cameras reduce fatal and serious injury crashes by 11% to 44%, while the UK Department for Transport reported a 22% drop in personal injury collisions and 42% fewer deaths or serious injuries at camera sites.

Speed cameras, meanwhile, address another leading cause of traffic fatalities: speeding, which contributed to 12,151 deaths in the U.S. in 2022, according to the National Highway Traffic Safety Administration (NHTSA). Evidence suggests they are effective at slowing drivers down. A 2024 report from the Fines and Fees Justice Center acknowledged that speed cameras reduce collisions by 20% to 37%, particularly in high-risk areas like school zones and work zones. Signs warning of camera enforcement further amplify this effect, encouraging compliance without necessarily issuing tickets.

However, the picture isn’t universally positive. Red light cameras, while reducing angle crashes, often increase rear-end collisions as drivers brake abruptly to avoid fines. A Houston study from 2003-2014 found that while total crashes dropped slightly after cameras were installed, rear-end accidents rose, offsetting some safety gains. Critics argue that this trade-off muddies their overall impact on driver safety. Additionally, the long-term behavioral change is questionable—fines mailed weeks later lack the immediacy needed to consistently deter violations, unlike physical road design changes such as roundabouts or longer yellow light timings, which have proven more effective in places like Fairfax County, Virginia (96% reduction in violations after extending yellow lights by 1.5 seconds).

In short, automatic cameras work to reduce specific dangerous behaviors and crash types, but their net safety benefit depends on context, implementation, and complementary measures. They are not a panacea, and their effectiveness can be overstated when revenue motives overshadow safety priorities.

Do They Generate Meaningful Revenue?

Revenue generation is a lightning rod in the debate over automatic cameras. Proponents argue that fines fund safety programs, while critics contend they turn drivers into cash cows for governments and private companies.

The financial haul can be substantial. In Illinois, red light cameras collected over $1.56 billion from 2008 to 2023, with Chicago alone accounting for $915.5 million. Chicago’s 169 speed cameras added another $102 million in 2023 from 1.56 million tickets. Maryland’s work zone speed cameras issued 335,888 citations in fiscal year 2023, generating $9.7 million, with fines set to rise from $40 to $250 by 2025. New York City’s red light camera program, expanded in 2024 to cover 10% of intersections, has been a steady revenue stream since 1994, though exact figures vary by year. In California, Rancho Cordova saw red light camera revenue soar from $73,000 to $742,000 between 2012 and 2016 after installing four cameras.

Yet, “meaningful” revenue is relative. For states or large cities, these sums are often a small fraction of total budgets. Florida collected $52 million from red light cameras across 76 jurisdictions in 2013, but this pales against its $100 billion-plus state budget. Texas, before banning red light cameras in 2019, directed excess revenue to trauma centers and transportation, suggesting a public benefit beyond profit. Conversely, smaller municipalities can become heavily reliant on camera income—Bedford Park, Illinois, issued 23 tickets per resident in 2022, raking in $8.3 million since 2008. Critics highlight cases like Crestwood, Illinois, where eight cameras in a town of 10,000 generated $13 million since 2016, pointing to a disproportionate burden on drivers.

Private companies like American Traffic Solutions (now Verra Mobility) and Redflex, often contracted to operate these systems, take a significant cut—sometimes up to 86% of profits, as noted in Arizona. This profit motive has fueled accusations of corruption, such as in Chicago, where a former official was jailed for bribery tied to camera contracts, or Oakbrook Terrace, where the ex-mayor admitted to kickbacks. Lockheed Martin’s contracts once prohibited cities like San Diego from adjusting yellow light times to maintain ticket flows, further stoking skepticism about safety-first claims.

While cameras undeniably generate revenue, their “meaningfulness” varies by jurisdiction. For some, it’s a vital funding source; for others, it’s a drop in the bucket overshadowed by ethical concerns and public backlash.

State Adoption of Automatic Cameras

The use of speed and red light cameras varies widely across the U.S., shaped by state laws, public opinion, and legislative trends. Below is a table detailing which states permit, restrict, or ban these systems as of March 31, 2025, based on available data and recent legislative updates.

State Red Light Cameras Speed Cameras Notes
Alabama Permitted Permitted Used in cities like Birmingham, Montgomery; no statewide ban.
Alaska No specific law No specific law Rarely used; no clear authorization or prohibition.
Arizona Banned Banned Statewide ban on photo enforcement since 2011.
Arkansas No specific law No specific law Rarely used; no clear authorization or prohibition.
California Permitted Permitted Expanded speed camera pilot in 2023 for safety corridors (e.g., LA, SF).
Colorado Permitted Permitted Local option; Denver uses both.
Connecticut Permitted Permitted Added noise cameras in 2024; red light/speed cameras in select areas.
Delaware Permitted Permitted Used in Wilmington and other locales.
Florida Permitted Permitted Red light cameras widespread; speed cameras in school zones.
Georgia Permitted Permitted Local discretion; Atlanta uses both.
Hawaii No specific law No specific law Limited use; no statewide policy.
Idaho No specific law No specific law Rarely used; no clear authorization.
Illinois Permitted Permitted Chicago leads with extensive red light and speed camera networks.
Indiana No specific law No specific law Minimal use; no statewide endorsement.
Iowa Permitted w/ permit Permitted w/ permit 2024 law requires DOT approval; bans mobile cameras in small towns.
Kansas No specific law No specific law Rarely used; no clear policy.
Kentucky No specific law No specific law Limited adoption; no statewide support.
Louisiana Permitted Restricted Reversed speed camera use on Atchafalaya Bridge in 2024.
Maine Banned Banned Statewide prohibition on automated enforcement.
Maryland Permitted Permitted Work zone speed cameras widespread; fines increasing in 2025.
Massachusetts No specific law No specific law Limited use; no statewide authorization.
Michigan Banned Permitted (work zones) 2024 bills allow speed cameras in work zones only.
Minnesota Permitted (limited) Permitted (limited) Allowed in Minneapolis and Mendota Heights work zones as of 2025.
Mississippi Banned Banned Statewide ban on traffic cameras.
Missouri Permitted Permitted Local use (e.g., St. Louis); no statewide ban.
Montana Banned Banned Red light cameras banned since 2009; speed cameras not authorized.
Nebraska No specific law No specific law Rarely used; no clear policy.
Nevada Permitted (handheld) Permitted (handheld) No automated ticketing; cameras must be officer-operated.
New Hampshire Banned Banned Statewide prohibition on automated enforcement.
New Jersey Banned Banned 2024 “Camera Enforcement Inoculation Act” limits out-of-state fines.
New Mexico Permitted Permitted Local option; Albuquerque uses both.
New York Permitted Permitted NYC expanded red light cameras in 2024; speed cameras in school zones.
North Carolina Permitted Permitted Local discretion; Raleigh and others use cameras.
North Dakota No specific law No specific law Minimal use; no statewide policy.
Ohio Permitted Permitted Local use; some restrictions on mobile speed cameras.
Oklahoma Banned Banned 2023 bill prohibits red light cameras; no speed camera use.
Oregon Permitted Permitted Portland expanded photo radar in 2023; relaxed police review rules.
Pennsylvania Permitted Permitted Philadelphia uses red light cameras; speed cameras in work zones.
Rhode Island Permitted Permitted Providence and others use both types.
South Carolina Banned Banned Statewide ban on automated traffic enforcement.
South Dakota Banned Banned Limits sharing driver info for out-of-state camera fines.
Tennessee Permitted Permitted Local option; Nashville uses both.
Texas Banned Permitted (school zones) Red light cameras banned in 2019; speed cameras limited to school zones.
Utah Banned Banned Statewide prohibition on automated enforcement.
Vermont Permitted Permitted Speed cameras allowed on I-89 and I-91 work zones as of 2025.
Virginia Permitted Permitted Local option; reversed ban in 2007 for cities over 10,000.
Washington Permitted Permitted Speed cameras in school/park zones; expanded in 2024.
West Virginia Banned Banned Statewide ban on traffic cameras.
Wisconsin Banned Banned Statewide prohibition on automated enforcement.
Wyoming No specific law No specific law Rarely used; no clear authorization.

Note: “Permitted” indicates state law allows local jurisdictions to use cameras, though adoption varies. “Banned” means a statewide prohibition exists. “No specific law” suggests no clear authorization or ban, often resulting in minimal use. Data reflects trends up to March 31, 2025, based on legislative updates from sources like GHSA, IIHS, and Land Line.

Conclusion

Automatic speed and red light cameras demonstrably reduce certain crashes—red light running and speeding-related incidents—saving lives in targeted scenarios. However, their safety benefits are tempered by increases in rear-end collisions and a reliance on fines that may not sustainably change behavior. Revenue generation is real and significant, especially for smaller municipalities, but it often comes with accusations of profiteering and inequity, disproportionately burdening low-income drivers. State adoption reflects this tension, with a patchwork of policies driven by safety goals, fiscal needs, and public resistance. Ultimately, while cameras can be part of a safety toolkit, engineering solutions like better road design may offer a more equitable and enduring path to safer streets.

Continue reading
self driving car future
Traffic Safety

How Self-Driving Cars Will Transform Traffic Safety


How Self-Driving Cars Impact Traffic Safety: Challenges and Benefits


How Self-Driving Cars Impact Traffic Safety: Challenges and Benefits

Self-driving cars, also known as autonomous vehicles (AVs), represent a revolutionary shift in transportation, promising significant enhancements in traffic safety by drastically reducing human error—the main cause of accidents. Yet, alongside their vast potential, AVs also present immediate challenges that must be carefully addressed.

Short-Term Challenges of Self-Driving Cars

Addressing Safety Incidents and Technical Limitations

Despite their promise, AVs have experienced notable safety incidents. IEEE Spectrum reports at least 25 fatalities linked to autonomous driving technologies in recent years, emphasizing the critical need for rigorous testing and continuous improvement of AV systems (IEEE Spectrum).

Navigating Regulatory and Legal Uncertainties

Regulatory ambiguity remains a significant barrier. Henry Liu, Director of Mcity at the University of Michigan, underscores the urgency of nationwide standardized regulations and testing frameworks. Without consistent regulations, companies struggle to safely and efficiently deploy AV technology across states (Associated Press).

Building Public Trust and Acceptance

Public perception is critical to the success of AVs. Surveys highlighted by the Financial Times reveal growing apprehension due to high-profile incidents. Ensuring transparency and effective communication about AV safety and reliability will be crucial for public acceptance (Financial Times).

Long-Term Benefits of Self-Driving Cars

Significant Reduction in Traffic Accidents

In the long term, AVs have the potential to significantly decrease traffic accidents. The Insurance Institute for Highway Safety (IIHS) demonstrates that automated emergency braking alone can reduce rear-end collisions by nearly 40%, pointing toward the larger potential impact of fully autonomous vehicles on overall safety (IIHS Study).

Enhanced Traffic Efficiency and Reduced Congestion

AV technology can dramatically improve traffic flow and efficiency. Research in Nature Communications indicates that synchronized AV communication at intersections can reduce congestion, optimize travel times, and significantly enhance commuter experiences (Nature Communications).

Effectively Managing Mixed Traffic Environments

However, the coexistence of human-driven and autonomous vehicles presents unique transitional challenges. According to the Brookings Institution, AVs must adeptly manage human unpredictability, requiring sophisticated technologies and thoughtful policy-making to ensure safety during the transition phase (Brookings Institution).

Conclusion: Navigating the Road Ahead

While self-driving cars promise transformative improvements in traffic safety, overcoming initial technical, regulatory, and perceptual hurdles is critical. Continued investment in research, clear communication, and proactive policy-making will ultimately dictate how rapidly and effectively autonomous vehicles become integrated into daily transportation.

© 2025 Traffic Safety Guide. All rights reserved.


Continue reading
Traffic Facts

Bad Traffic In Ancient Rome ?


Traffic in Ancient Rome

Traffic in Ancient Rome

Overview: Ancient Rome, at its height, had a population possibly exceeding one million residents. This large urban center faced challenges in managing the flow of carts, wagons, and pedestrians on narrow streets, prompting early forms of traffic regulation and safety measures. Below is a concise, well-researched overview of how the ancient Romans experienced and managed traffic and traffic safety in the city of Rome.

1. The Nature of Traffic in Ancient Rome

1.1 Rome as a Bustling Metropolis

By the 1st century BCE, Rome had grown into a vast city with a dense population. A city of that size naturally saw a great deal of activity:

  • Commerce and Trade: Goods flowed into Rome from all over the empire, requiring wagons and carts to transport merchandise.
  • Urban Mobility: People traversed the streets on foot or by horse-drawn vehicles, sedan chairs, or even on horseback.
  • Social and Civic Events: Major festivals, processions, and public ceremonies often caused large crowds and restricted normal traffic.

Although ancient Rome lacked modern automobiles, the movement of people and horse-drawn wagons often led to congestion reminiscent of today’s traffic jams.

1.2 Road Infrastructure

Rome’s famed road network extended throughout the empire, but the city streets themselves could be narrow and winding:

  • Paved Streets: Many major roads in Rome were paved with stone slabs, enabling relatively smoother travel compared to dirt surfaces.
  • Sidewalks and Drainage: In higher-status areas, elevated sidewalks and drainage systems helped keep pedestrians separate from carts.

These infrastructural innovations eased travel somewhat, but population growth often outstripped the city’s design, leading to high levels of congestion near markets, the Forum, and other busy districts.

2. Legal Restrictions and Attempts to Manage Traffic

2.1 Julius Caesar’s Traffic Regulations

One of the earliest known legal measures to address overcrowded streets came under Julius Caesar in the 1st century BCE:

  • Time Restrictions: Heavy wagons were prohibited from entering the city center during daylight hours, thereby reducing congestion for much of the day.
  • Exceptions: Certain vehicles, such as those belonging to high-ranking officials or the Vestal Virgins, were granted exemptions.

Caesar’s approach was designed to ease daytime traffic and improve mobility for ordinary citizens.

2.2 Other Imperial Era Edicts

Later emperors refined Caesar’s restrictions:

  • Limiting the Number of Carts: Authorities often restricted pack animals and wagons during peak hours, reducing noise and crowding.
  • Road Maintenance Laws: Aediles (magistrates in charge of public amenities) repaired roads and enforced weight limits on carts.

These measures illustrate official recognition of traffic congestion as a public safety issue.

3. Early Approaches to Traffic Safety

3.1 The Threats of Ancient Traffic

Even with slower vehicles, accidents were common:

  • Collisions: Narrow streets increased the likelihood of carts colliding with each other or with pedestrians.
  • Pedestrian Injuries: Minimal street lighting and a lack of standardized lanes exposed pedestrians to dangers from horses or wagons.
  • Road Hazards: Uneven pavement and obstructed roads led to trips, falls, and vehicle overturns.

3.2 Safety Measures

Although there were no traffic lights or modern speed limits, several practices enhanced safety:

  • Raised Sidewalks: Pedestrians were protected from wheels and hooves, and stepping stones provided a rudimentary crosswalk system.
  • Dedicated Routes and Times: Restricting certain vehicles to night deliveries was an early form of “road rationing,” reducing daytime crowding.
  • Use of Milestones: Along roads outside the city, milestones aided navigation and logistics, indirectly helping to prevent congestion.
  • Oversight by Aediles: Aediles could fine owners of carts in disrepair or vehicles overloaded beyond safe capacity.

4. Social and Cultural Factors Affecting Traffic Management

Several broader factors shaped how Romans managed traffic:

  • Status and Class: Elite Romans often traveled by litter (a carried sedan chair). This method could bypass some congestion but also create bottlenecks if accompanied by large retinues.
  • Public Events: Major festivals, triumphs, and religious observances temporarily banned non-essential traffic in certain areas, alleviating some congestion.
  • Nighttime Noise and Curfews: Many authors, such as Pliny the Younger, complained about carts rumbling through the streets at night, highlighting that shifting traffic to off-hours created new problems.

5. Evaluating Ancient Rome’s Traffic Measures

Rome’s strategies, while rudimentary by modern standards, demonstrate a clear effort to deal with a large city’s challenges:

  • Congestion Recognition: Time-based vehicle restrictions showed that Roman leadership saw traffic as an economic and social issue.
  • Basic Safety Infrastructure: Sidewalks, stepping stones, and penalties for poorly maintained carts offered early standards for public safety.
  • Centralized Regulation: The existence of officials like aediles indicates Rome’s commitment to organized urban management.
  • Balancing Commerce and Comfort: Restricting heavy traffic to off-peak hours helped maintain daytime flow but led to nighttime noise and occasional accidents.

Conclusion

Although ancient Romans did not face motorized vehicles or the vast fleet of cars we see today, the city’s dense population and many wagons, carts, and animals created notable congestion. Time-based restrictions, raised sidewalks, and continuous road maintenance all emerged as ways to manage the challenges of a bustling metropolis. These measures, though simple, represent a surprisingly forward-thinking approach to urban mobility and public safety—a testament to Rome’s enduring legacy of engineering and governance.


Continue reading
Traffic Safety

If a Traffic Cone is not Orange, is it a Traffic Cone?


Traffic Cone Legality Colors

Traffic Cone Legality and Colors

When picturing a traffic cone, the first color that likely comes to mind is bright orange. This fluorescent hue is widely recognized as an indicator of caution and is universally associated with road safety. But what happens when a traffic cone isn’t orange? Is it still a traffic cone—and more importantly, is it legal?

Traditionally, traffic cones are colored bright orange because this color is highly visible, making them ideal for signaling caution and guiding drivers through construction zones or traffic diversions. However, the definition of what constitutes a traffic cone does not exclusively rely on color.

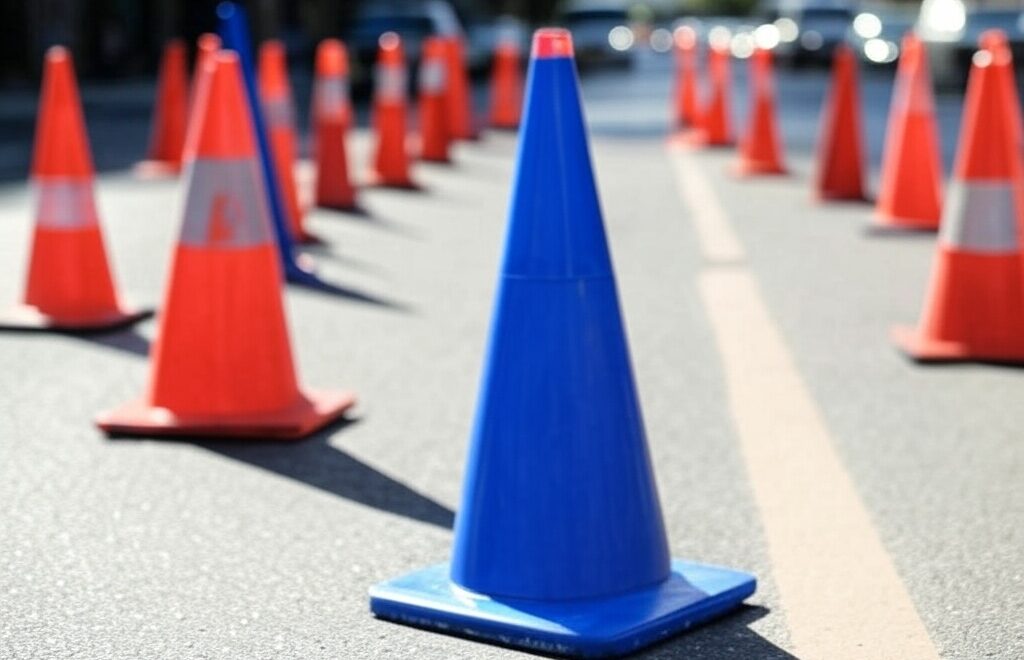
In many jurisdictions, a traffic cone is legally defined by its function and shape rather than color alone. For example, cones can also come in reflective white, yellow, green, or even blue. Each color typically represents a different function: white cones might signify pedestrian areas or parking spaces, blue can indicate accessibility parking or areas reserved for disabled individuals, green cones are sometimes used to mark entrances to secure areas or work zones, and yellow cones often indicate no-parking zones or cautionary warnings beyond general construction alerts.

Legally, the color requirement varies depending on local and national regulations. In the United States, the Manual on Uniform Traffic Control Devices (MUTCD) issued by the Federal Highway Administration provides guidelines rather than strict mandates. It specifies that cones used during the daytime must be predominantly orange and for nighttime use should have reflective material for enhanced visibility. However, there can be variations allowed under specific circumstances or by local regulations, provided they serve an appropriate safety purpose.

In the United Kingdom, traffic cones must comply with British Standard BS EN 13422:2004, typically mandating the bright orange color with reflective sleeves. Similar standards exist throughout the European Union and other countries, though local variations might permit the use of alternative colors for specialized purposes.

Therefore, if a cone is not orange, it can still legally be considered a traffic cone if it complies with local safety and regulatory requirements regarding visibility, reflective properties, and specific situational use. While the orange cone remains iconic, the broader palette serves a meaningful safety and organizational purpose across various contexts.

In conclusion, a non-orange traffic cone is indeed still a traffic cone, as long as it adheres to local regulations and fulfills its intended function effectively and safely. Its legality is tied not to its color alone but rather to compliance with standards that ensure road safety.


Continue reading
Related posts
Why do people Steal Traffic Cones
March 27, 2025
stealing a traffic cone
Traffic Safety

Why do people Steal Traffic Cones


Why Do People Steal Traffic Cones?


Why Do People Steal Traffic Cones?

A Look at Psychology, Society, Pop Culture, and Legal Consequences

Introduction

Stealing a traffic cone might sound random at best and pointless at worst—yet it’s surprisingly common. From college dorms proudly sporting neon-orange souvenirs to social media posts celebrating quirky cone rescues, this odd phenomenon raises a question: why on Earth do people do it? Below, we delve into the psychology, sociology, lighter pop culture angles, and the legal repercussions behind traffic cone theft in the United States.

1. The Psychological Angle

Rebellion and Thrill:
Traffic cones are public property—clearly not meant for private collecting. Yet, a small act of defiance can be exciting. Swiping a cone provides a fleeting “rush” because it’s mischievous, but generally perceived as low-stakes compared to bigger crimes.

Peer Pressure and Group Dares:
The simple moment of “I dare you to grab that cone” often seals the deal. In a group setting—especially among friends—this quick challenge becomes an entertaining anecdote. Many cone thieves admit they did it on impulse or when a friend egged them on.

Feeling of Ownership:
Cones often look “unclaimed,” sitting outside without direct supervision. This perceived detachment can lead people to rationalize that taking it isn’t truly hurting anyone. Of course, the reality is different: cones are crucial for public safety and traffic control.

2. A Sociological View

Who’s Doing It?
Most stories about cone theft involve young adults—commonly college students. Dorm rooms adorned with “borrowed” cones aren’t unheard of, especially in party-centric college towns. That said, there have been incidents involving older adults, too—sometimes even using stolen cones to reserve their own parking spots.

Where and When:
Theft often happens at night or during holidays and events where crowds gather (think block parties, college homecomings, and festivals). Alcohol can also lower inhibitions. The result: a once-strict rule follower might morph into someone who decides a bright orange souvenir is just too tempting.

Impacts on Public Services:
Believe it or not, traffic cone theft can become a budgetary concern for cities. Departments of Transportation and Public Works need to reorder cones regularly because so many go missing. This cost eventually trickles down to taxpayers.

3. Humor, Memes, and Pop Culture

Social Media Moments:
Cones are visually iconic—bright, tall, and shaped perfectly for silly “cone hats” or comedic videos. It’s no wonder social media is awash with photos of people posing with traffic cones after a night out. This playful imagery has transformed the cone into a weird sort of internet celebrity.

Campus Lore:
From informal competitions to see who can collect the most cones to comedic “pranks” staged in dorm lobbies, cone theft is an oft-retold tale in college folklore. It’s one of those odd, harmless-seeming comedic rites of passage for some students.

Beyond the States:
While focusing on the U.S., it’s fun to note that cone humor is global. In Glasgow, Scotland, a famous statue of the Duke of Wellington is perpetually topped with a traffic cone—a local tradition so beloved that attempts to stop it have repeatedly failed. Though not exactly “theft,” it shows how deeply entrenched cone hijinks have become worldwide.

4. Stats and Notable Examples

  • One million cones stolen? Some estimates suggest that as many as a million cones disappear from American streets each year. Not all vanish due to theft; some are destroyed or lost. Still, theft accounts for a significant chunk.
  • Philadelphia: The city reportedly has to buy thousands of replacement cones annually, often because the originals “walk away.”
  • Connecticut: One town started a social media campaign asking residents to return cones taken during storms, as nearly all of them had vanished overnight.

These real-world anecdotes highlight how minor pranks can add up to major headaches for municipalities.

5. Legal Consequences and Enforcement

Is It Illegal?
Yes. Even though a traffic cone might cost only $20–30, it’s still government or contractor property, so taking one constitutes theft. If you’re caught, penalties vary by state but may include fines or even misdemeanor charges.

Enforcement Reality:
Police might not prioritize every missing cone, but if they catch someone red-handed—especially if the theft leads to a hazardous situation—expect legal trouble. In certain places, a rash of cone thefts has led to stricter crackdowns, including arrests.

Safety Risk:
Apart from legal risks, removing cones can endanger drivers and pedestrians. Cones mark hazards like potholes or temporary lanes. When they disappear, accidents become more likely.

Conclusion

Whether it’s for the thrill, a social dare, a comedic Instagram post, or a misguided plan to claim a parking space, traffic cone theft is a peculiar phenomenon with broader consequences than one might expect. In the U.S., it’s mostly fueled by the fun of rebellion and a dash of peer pressure, but it also wastes city resources and risks public safety. So next time you see a cone sitting quietly by the roadside, remember it has an important job—maybe think twice before turning it into your next novelty souvenir.


Continue reading
Related posts
If a Traffic Cone is not Orange, is it a Traffic Cone?
March 28, 2025
Traffic Safety

Brief History of the Stoplight, why Red, Green, Yellow?


History of Traffic Light Colors


Why Traffic Lights Are Red, Yellow, and Green

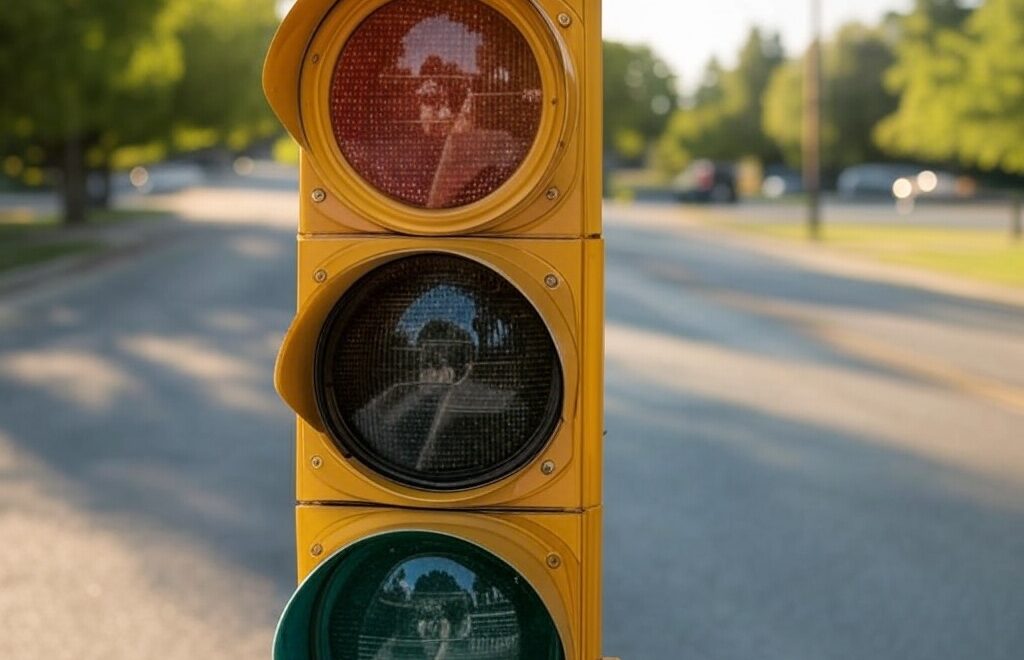
Have you ever paused at a stoplight and wondered, “Why exactly is red for stop, green for go, and yellow for caution?” The colors of our everyday traffic lights weren’t randomly selected; their history goes back much further than automobiles themselves, rooted deeply in human psychology, historical context, practicality, and cultural significance.

The Significance of Red

Originally, railway signals used color coding to control trains, influencing early transportation pioneers who adapted these signals for roadways. Red, universally recognized as a color of danger and caution due to its high visibility and long wavelength, naturally became the choice to signify “stop.” Long before cars, maritime vessels used red lanterns to signal warnings at night, and even medieval knights associated red banners and flags with danger or imminent battle. Psychologically, red evokes a sense of urgency, effectively prompting immediate reactions from drivers.

Why Green Means Go

Green, positioned opposite red on the visible spectrum, became a natural candidate for “go.” It offers clear visual contrast, minimizing confusion among drivers. Historically, green has symbolized safety, permission, fertility, growth, prosperity, and freedom to proceed, making it intuitive and positive in its use on roads. Psychologically, green is calming and reassuring, reinforcing its suitability for indicating safe passage. Additionally, green is easily discernible from greater distances.

The Role of Yellow

Yellow sits between red and green on the visible spectrum and logically represents caution or preparation. Originally, railway systems experimented with white as a caution signal, but white lights were often mistaken for stars or other ambient lights, causing dangerous confusion. Yellow, distinctly visible and easily differentiated from other lights, replaced white. Yellow psychologically signals alertness, ensuring drivers maintain awareness of changing conditions.

Global Standardization

The first three-color traffic signal was installed in Detroit in 1920, developed by police officer William Potts. His innovation combined necessary safety cues from railway signals with practical urban traffic needs, laying the foundation for standardized traffic control worldwide. By 1935, traffic lights in the United States uniformly adopted the red-yellow-green configuration to manage increasingly congested roads safely.

Over time, international agreements such as the Vienna Convention on Road Signs and Signals formally standardized these colors globally, transcending cultural and linguistic barriers. Today, this simple trio of colors effectively regulates traffic worldwide, enhancing global road safety and managing traffic efficiently.

Beyond Traffic Lights

These colors have influenced other safety-related areas and signage, demonstrating the broad influence and intuitive nature of the red-yellow-green system. The ongoing reliance on this system highlights humanity’s universal understanding of risk, caution, and safety—a testament to the lasting effectiveness of this simple yet essential signaling system.


Continue reading
Traffic Safety

Most popular car and truck colors for 2024


Which Colors Were Popular for Cars and Trucks in 2024?

Which Colors Were Popular for Cars and Trucks in 2024?

Every year, automotive color popularity shifts in subtle or sometimes surprising ways.
According to trusted industry authorities like
Axalta
and
PPG,
certain hues stand out both in showroom sales and on the roads. Let’s explore the top five
most popular colors for cars and trucks in 2024 and why they continue to dominate.

1. White

According to the 2024 Axalta Global Automotive Color Popularity Report, white once again
topped the list for its widespread appeal. This crisp, modern color not only exudes a sense of cleanliness
but also tends to hide everyday dirt. Whether it’s a compact city car or a full-sized work truck,
white remains the go-to for buyers looking for a sleek, yet low-maintenance finish.

2. Black

The PPG 2024 Automotive Color Trends Survey highlights black’s enduring popularity, especially
for luxury models and full-size trucks. This sophisticated hue provides a premium feel and can dramatically
showcase a vehicle’s contours. Although black may require more frequent cleaning to maintain its deep luster,
it continues to be a mainstay choice for many drivers seeking a bold statement.

3. Silver

Silver has historically been a top contender, and 2024 was no exception. Per Axalta’s and PPG’s findings,
silver’s timeless, practical qualities resonate with a wide range of consumers. It strikes a balance between
the brightness of white and the understated elegance of gray. Its reflective nature can also help keep a
vehicle cooler in sunlight, making it a practical choice in warmer climates.

4. Gray (Gunmetal and Charcoal)

Gray shades—including gunmetal and charcoal—have experienced a surge in market share over the past few years.
The 2024 Axalta Report indicates that gray’s ascent owes to its contemporary style and ability to mask
light dust or road grime. Many truck owners in particular gravitate towards darker grays for a rugged look
that pairs well with custom accessories.

5. Red

Rounding out the top five, red continues to captivate those looking for something sporty and attention-grabbing.
PPG’s survey data reveals that red is often associated with performance cars and off-road trucks designed to
stand out. Despite its smaller share compared to neutral shades, red remains a beloved choice for drivers
who prefer a bit more flair.

Why These Colors Lead the Pack

Year after year, the dominant colors often share common traits: versatility, broad market appeal, and good
resale value. Neutrals—like white, black, silver, and gray—attract buyers from all walks of life, ensuring
strong demand in used-car markets. Red, although more niche, delivers a strong visual impact that appeals
to enthusiasts and drivers who value a standout aesthetic.

Key Takeaways for 2024 Buyers

When choosing a color for your next vehicle, considering resale value and maintenance can be just as
important as personal preference. If you’re leaning toward a showstopper hue like red, remember it may
require a bit more dedication to keep it looking vibrant. If a lower-maintenance option is more your style,
neutral tones offer easy upkeep and broad appeal down the line.

In the end, the best color is the one that you’ll love every time you see it in the driveway.
Whether you choose a top favorite like white or black—or a bolder color that bucks the trend—make sure it
reflects your personal taste and meets your practical needs.


Continue reading
Highway Safety

What is the Ideal Highway Drving Speed?


The Ideal Speed to Drive on Highways


The Ideal Speed to Drive on Highways

By TrafficSafe Today

Introduction

Determining the “ideal” speed to drive on highways can be a nuanced topic. While
speed limits and regulations differ across countries—and sometimes even within
regions of the same country—experts generally agree that striking a balance
between safety, efficiency, and legality is key. This article aims to provide
a broad overview of factors that influence what might be considered an “ideal”
highway driving speed.

Following Posted Speed Limits

The most straightforward guideline for choosing your driving speed is to follow
the posted speed limit. These limits are typically set by local or national traffic
authorities and are informed by studies on:

  • Road design and capacity
  • Accident statistics
  • Average traffic flow
  • Environmental factors (e.g., terrain, weather patterns)

In the United States, for instance, highway speed limits commonly range between 55
and 70 miles per hour (mph), although some rural stretches of highway may allow up
to 80 mph or more. In many European countries, limits often range from 90 to 130
kilometers per hour (km/h), depending on location, road conditions, and national
regulations.

The 85th Percentile Rule

Traffic engineers often refer to the “85th percentile rule” when setting speed
limits. This principle suggests that the majority of drivers naturally choose
a safe and reasonable speed for road conditions. By measuring how fast 85% of
vehicles travel on a given stretch of road, authorities can determine a
realistic—and therefore safer—speed limit.

While this approach helps reduce speeding violations and promote smoother traffic
flow, it does not eliminate the need to adjust driving speeds for current conditions.
Rain, snow, heavy traffic, road construction, and other factors can make even a
posted speed limit less than ideal in certain situations.

Balancing Safety and Efficiency

Maintaining a consistent speed that keeps pace with the flow of traffic is usually
considered safer than driving significantly slower or faster than other vehicles.
Driving well below the prevailing speed can cause abrupt lane changes and sudden
braking, increasing the risk of collisions. Conversely, driving too fast reduces
reaction time and makes it harder to respond to unexpected hazards.

Key points to keep in mind:

  • Always adjust your speed for adverse weather and visibility conditions.
  • Keep a safe following distance to allow for adequate reaction time.
  • Ensure that you are comfortable and in full control of your vehicle, free
    from distractions like mobile phones.
  • Monitor changes in speed limits or warning signs, especially in work zones.

Fuel Efficiency Considerations

Fuel efficiency often peaks at moderate speeds—typically between 50 and 60 mph
(80 and 96 km/h) for many vehicles—though the exact range can vary based on engine
type, aerodynamics, and vehicle load. Driving above these speeds can increase
aerodynamic drag, which in turn can lower overall miles per gallon (MPG) or
kilometers per liter (km/L).

From an environmental and cost-saving perspective, maintaining a moderate,
steady speed can help reduce fuel consumption. That said, you should still keep
up with traffic flow and follow local regulations; never compromise safety by
traveling significantly slower than the speed limit in a fast-moving lane.

Local Laws and Guidelines

The ideal speed can also be shaped by local laws or recommended practices. For
example, some regions have “variable speed limits” that change in real time based
on traffic flow, weather, or road incidents. Meanwhile, certain portions of the
German Autobahn have no fixed speed limit, though a “recommended speed” (usually
130 km/h) is still advised for safety and liability reasons.

According to organizations like the

National Highway Traffic Safety Administration (NHTSA)

in the United States and the

European Commission’s Road Safety Policy

in the EU, observing speed limits and adjusting to current road conditions
significantly reduce the risk of road traffic collisions.

Conclusion

While there is no one-size-fits-all “ideal speed” that applies to every highway
and every situation, the general rule of thumb is to adhere to posted speed limits
and stay in harmony with the flow of traffic. This helps ensure safety and reduces
congestion. Factors like road design, prevailing conditions, and the physical
capabilities of your vehicle also play a vital role in determining the most
appropriate speed.

Ultimately, defensive driving habits—respecting other road users, staying alert,
and exercising caution—are just as important as the number on your speedometer.
By considering all these elements, drivers can help create a safer, smoother,
and more efficient journey for everyone on the road.

© 2025 TrafficSafe Today


Continue reading